
US Dollar News: CPI Test Puts Fed and FX Policy in Focus
As we enter August 11, attentions are on the anticipated July CPI data to be released on Wednesday. The result of this CPI data will ultimately decide if the Fed continues its pause on rate increases or if it resumes tightening in September. Economists expect a 0.2% month-on-month increase in the core CPI. Pocket appreciations, consistent with that forecast, would likely reflect inflation returning to the Fed’s 2% target. In June, the Fed’s preferred core inflation measure was reported at 3.3% with an increase from the previous year at 2.8%.
Prior expectations around interest rates have become unpredictable as the persistent inflation and regional energy shocks challenge Chair Warsh’s decision to keep rates the same in the last meeting, despite the three dissents for a rate increase. Additionally, President Trump’s Larry-Kudlow-like policies to undermine the Fed’s deliberations and autonomy by targeting a Fed Governor have added to the already increasing fundamental risks of the dollar.
There are also many uncertainties for the euro. Recent news out of Washington indicate that the yen was propped up by the recent dollar selling done by the U.S. Treasury. This has also sparked questions around currency coordination and if the U.S. Treasury was working to support the dollar while avoiding pressure on the bond market. For the ECB, that equates to staying the course for now following their last policy meeting in July.
Sterling is focusing on this week’s second-quarter UK GDP data. Most economists say the economy grew by around 0.4% in Q2. This would follow Q1’s 0.6% growth. Despite the challenges of the Iran situation and supply chain issues, activity remained resilient. The data will matter for the Bank of England as stronger data means the bank can keep an eye on inflation risks. The data will also affect the U.S. dollar, euro, and pound. Weaker figures would mean the BoE would do more to fight inflation. For now, U.S. CPI is the most important data for the currency markets. PPI and retail sales data are also important this week.

U.S. Dollar Index Technical Analysis: DXY Holds Rising Trendline but Remains Below Key EMAs
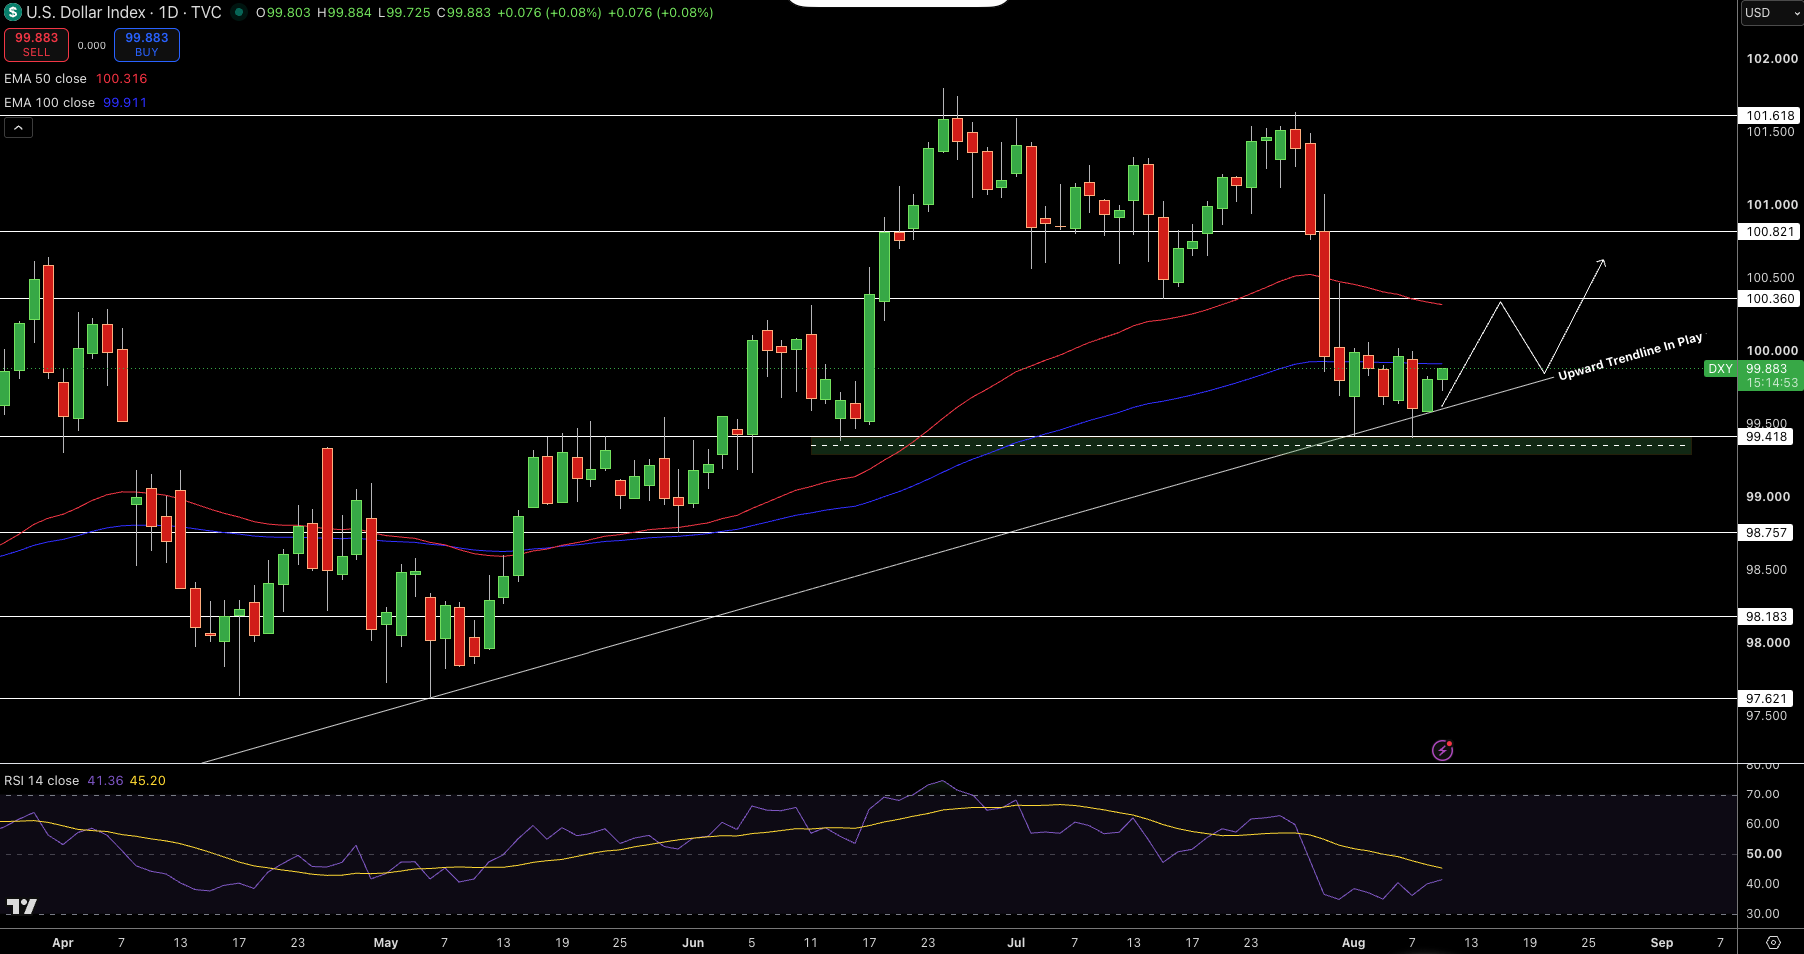
The US Dollar Index currently trades at $99.88. The index is currently trading slightly above the rising trendline and a key horizontal support at $99.42. Although the index trades above the rising trendline and horizontal support, the index is currently trading below the 50-day EMA ($100.32) and the 100-day EMA ($99.91) and therefore bears still control the index. Buying pressure is apparent from the most recent candles defending the rising trendline. This, however, is not enough to be considered a bullish trend, and is currently lacking confirmation.
The RSI is currently at 41, which indicates that the selling pressure has diminished, however the RSI is still below the neutral mark at 50. Resistance for the index is expected at $100.36, $100.82, and $101.62. In the event the index falls, support is expected at $99.42. Below $99.42 is expected support at $98.76 and $98.18.
EUR/USD Price Forecast
Every new EUR/USD analysis as it publishes, today's technical signal and key levels, live price — on one page.
See all EUR/USD forecastsGBP/USD Technical Analysis: Sterling Tests Rising Trendline Near $1.3500
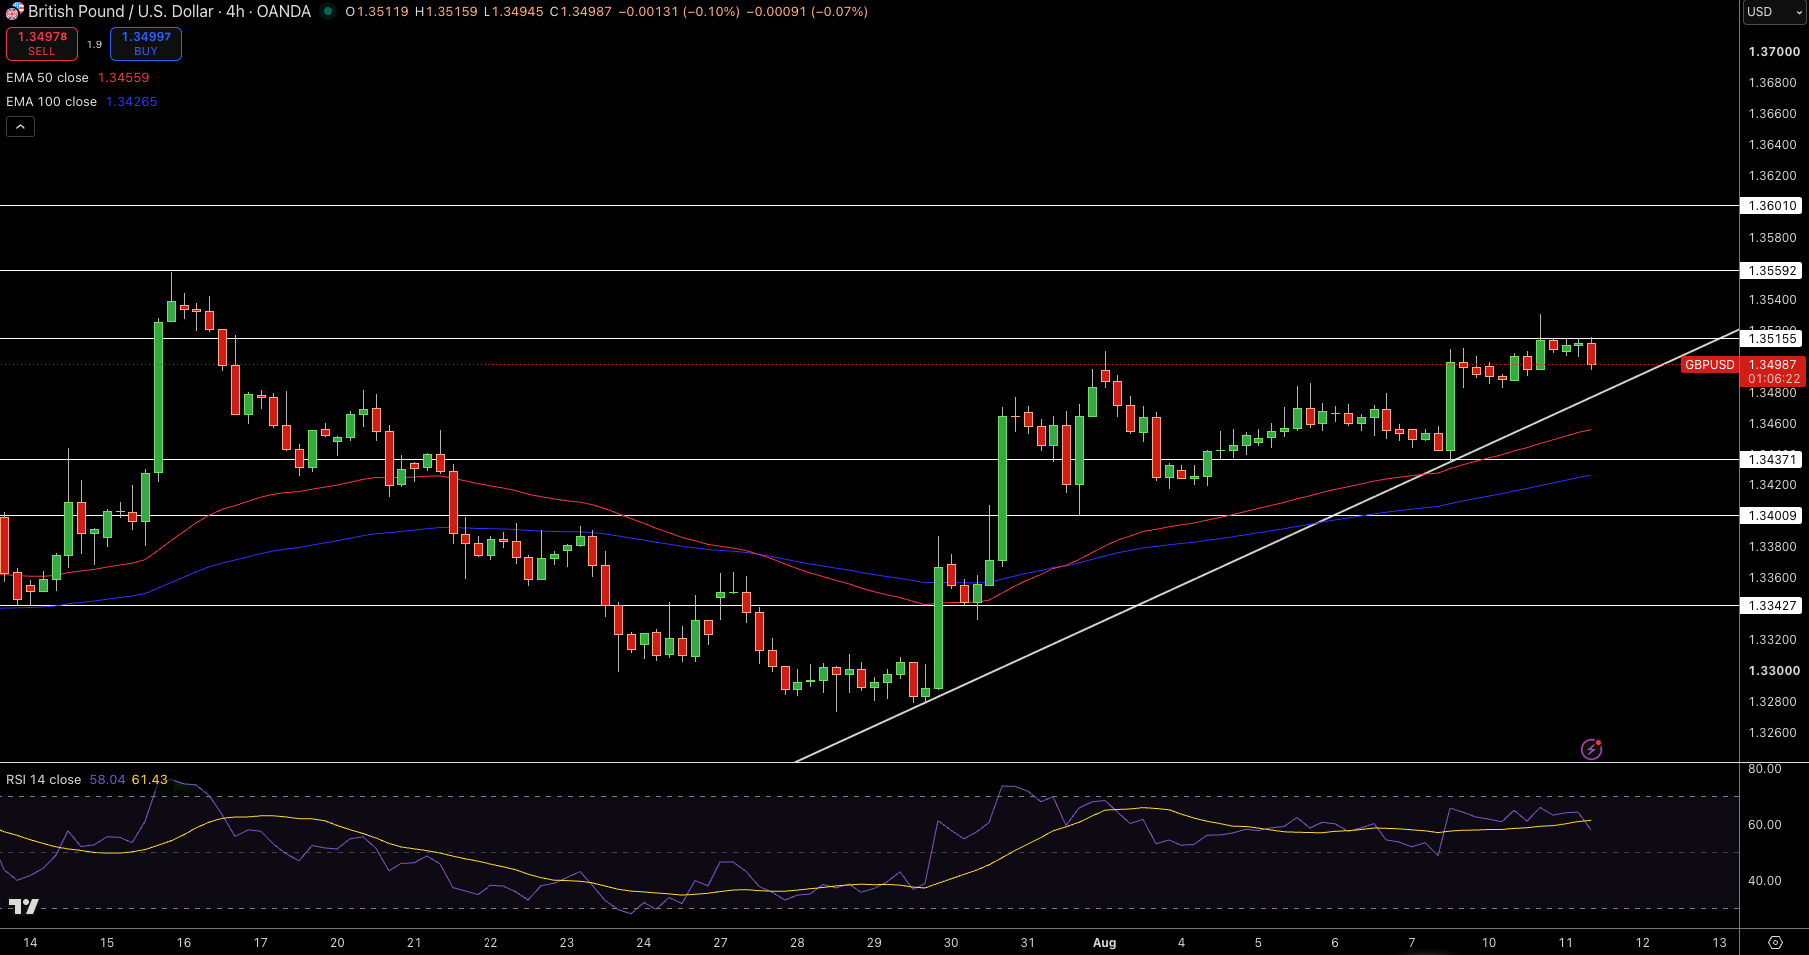
GBP/USD is trading around $1.3499, and is still trading above the rising trendline which supported the recovery since late July. The price is also still above the 50-period EMA at $1.3456 and the 100-period EMA at $1.3427, and although the price has been consolidating, the structure is still Bullish. Smaller bodies around the $1.3500 area suggest hesitation.
They are not large enough to indicate a reversal. The RSI is at 58, suggesting there is bullish momentum, which is healthy, but still not overbought. The areas of resistance for this momentum are $1.3516, $1.3559 and $1.3601. Moving in the other direction, support for this momentum is $1.3437, $1.3401 and $1.3343. In my opinion, if the GBP/USD is able to trade above the rising trendline, the Bullish setup is intact. I also believe that a break above $1.3516 could extend the move toward $1.3559.
EUR/USD Technical Analysis: Euro Stalls Below Long-Term Trendline at $1.1556
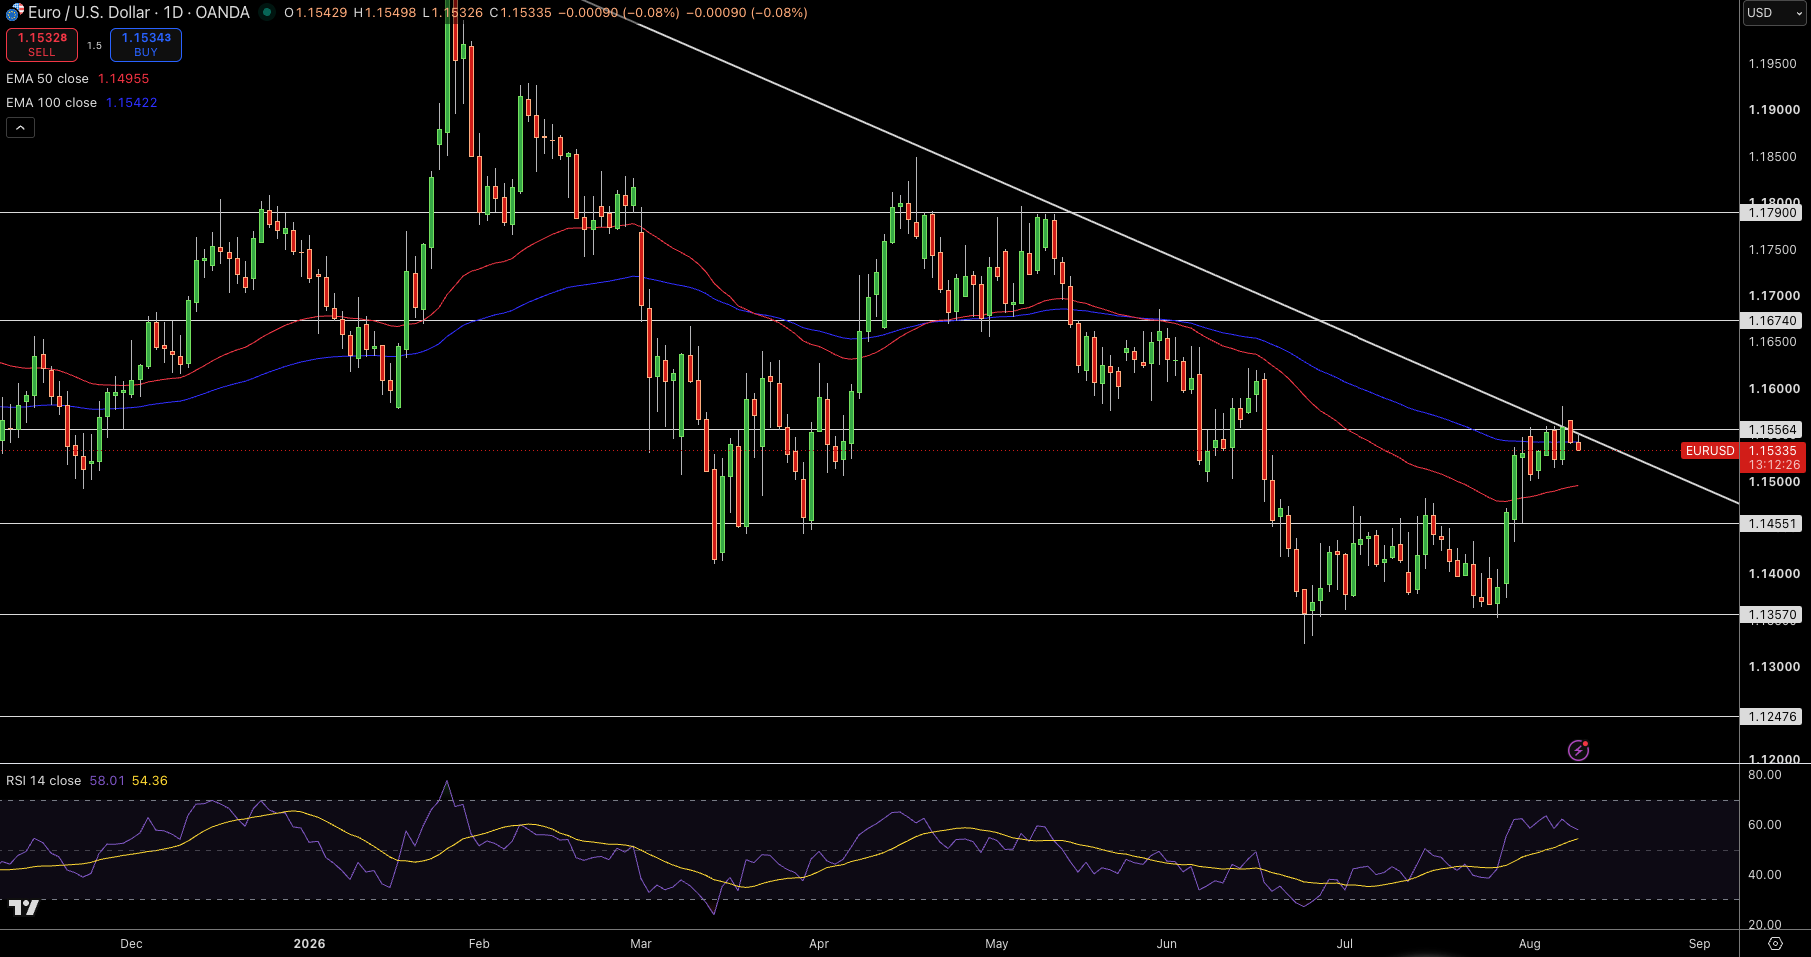
EUR/USD currently stands at $1.1534. Price activity shows the Euro trading along the long term falling trendline from where multiple attempts to move higher have been capped. The 50 day moving average (MA) stands at $1.1496, while the 100 day MA stands at $1.1542, and the EUR/USD is positioned below the 50 day MA indicating recent resistance.
Recent price movement has shown that the buyers could be losing steam after the strong bounce from $1.1357, and resistance has been built at $1.1556. The RSI (relative strength index) has an open bullish setup at 58, although a clean break above is what is called for.
In the short term, $1.1556 is the first resistance level, followed by $1.1674 and then $1.1790. In the short term, $1.1455 is the first major support level with the next support level standing firmly at $1.135