
Advertisement
Advertisement
US Equity Indices’ Technical Update: 20.01.2017
By:
Dow Jones Industrial Average Having repeatedly failed to surpass 19985 – 20000 horizontal-region, the DJI30 seems inclined to revisit 50-day SMA figure of
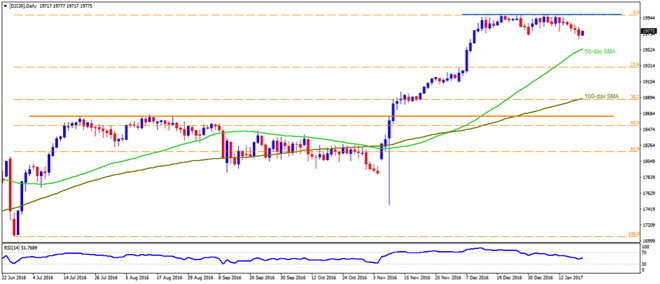
Dow Jones Industrial Average [DJI30]
Having repeatedly failed to surpass 19985 – 20000 horizontal-region, the DJI30 seems inclined to revisit 50-day SMA figure of 19535; however, 19660-70 is likely offering immediate support to the leading US equity Index ahead of Mr. Donald Trump formally become US President. Should the gauge dip below 19535, it can quickly plunge to 23.6% Fibonacci Retracement mark of 19290 and then to 19060 before meeting the 19000 round figure. On the contrary, 19830 and the 19920 can act as nearby resistances, breaking which the index can again confront 19985 – 20000 area. In case if the quote manage to surpass 2000 on a daily closing basis, the 20300 might act as an intermediate halt ahead of propelling it towards straight to 21000.
S&P 500 [SP500]
Considering the S&P 500’s 2252-82 range, the index is presently aiming towards 2282 but 2276 may offer immediate cap. Though, chances are higher that an upbeat statement from US President can propel the gauge beyond 2282 and rally towards 61.8% FE level of 2297 before challenging 2300 round figure. On the successful trading beyond 2300, 100% FE level of 2335 and the 2350 are likely north-side numbers that can please Bulls. Meanwhile, a dip below 2252 becomes a trigger for the fresh south-run of equity index towards 50-day SMA level of 2236 and then to 2232. If at all the sellers dominate market below 2232, chance of seeing 2213 and 2200 on the chart can’t be denied.
Nasdaq [NQ100]
Even if the NQ100 continue rising towards north, resistance-line of nearly two-month old “Rising-Wedge” formation, at 5088 now, might confine its additional upside and can drag the index to 61.8% FE level of 5033. Given the pullback stretches a bit more below 5033, the 5000 mark and the 4965 may act as buffer prior to fetching the prices to formation support of 4950. In case of the quote’s daily closing below 4950, the bearish formation gets confirmed and it becomes vulnerable to plunge towards 100-day SMA figure of 4860. Alternatively, a daily closing above 5088 may have 5100 as adjacent rest prior to rallying towards 100% FE mark of 5145. Should buyers keep favoring the index beyond 5145, it becomes wise to expect 5200 figure.
Cheers and Safe Trading,
Anil Panchal
About the Author
Anil Panchalauthor
An MBA (Finance) degree holder with more than five years of experience in tracking the global Forex market. His expertise lies in fundamental analysis but he does not give up on technical aspects in order to identify profitable trade opportunities.


Advertisement