


EUR/USD
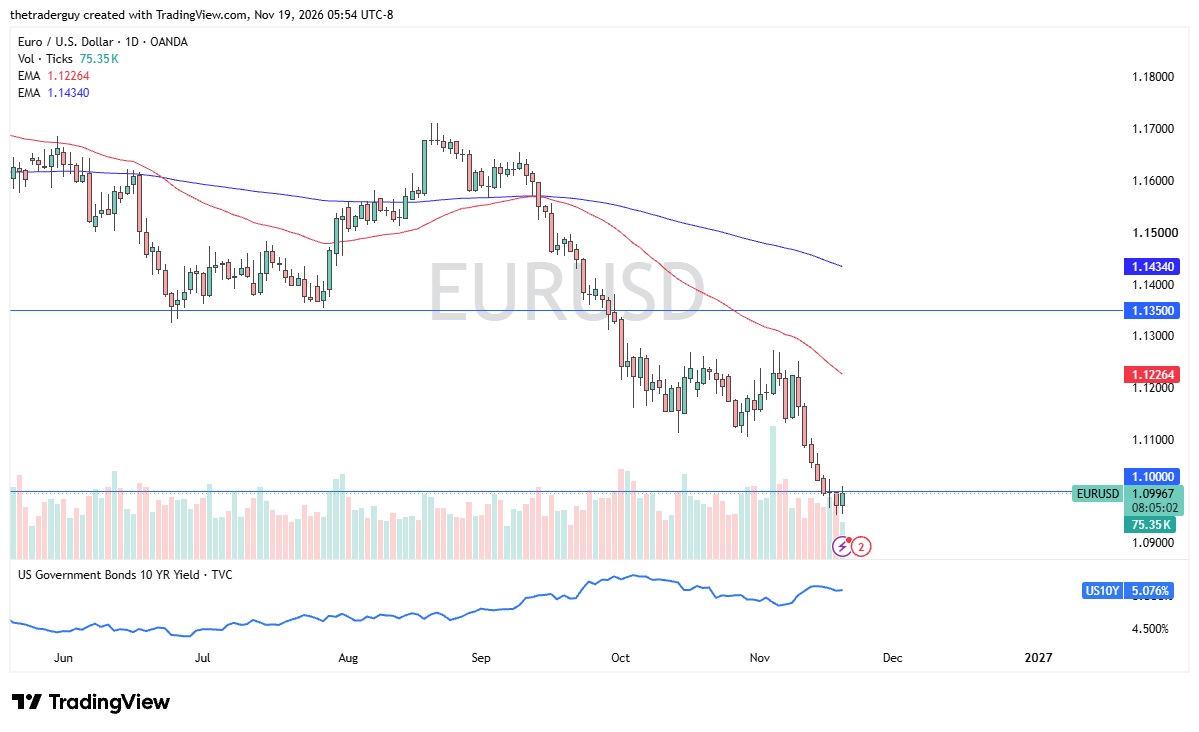
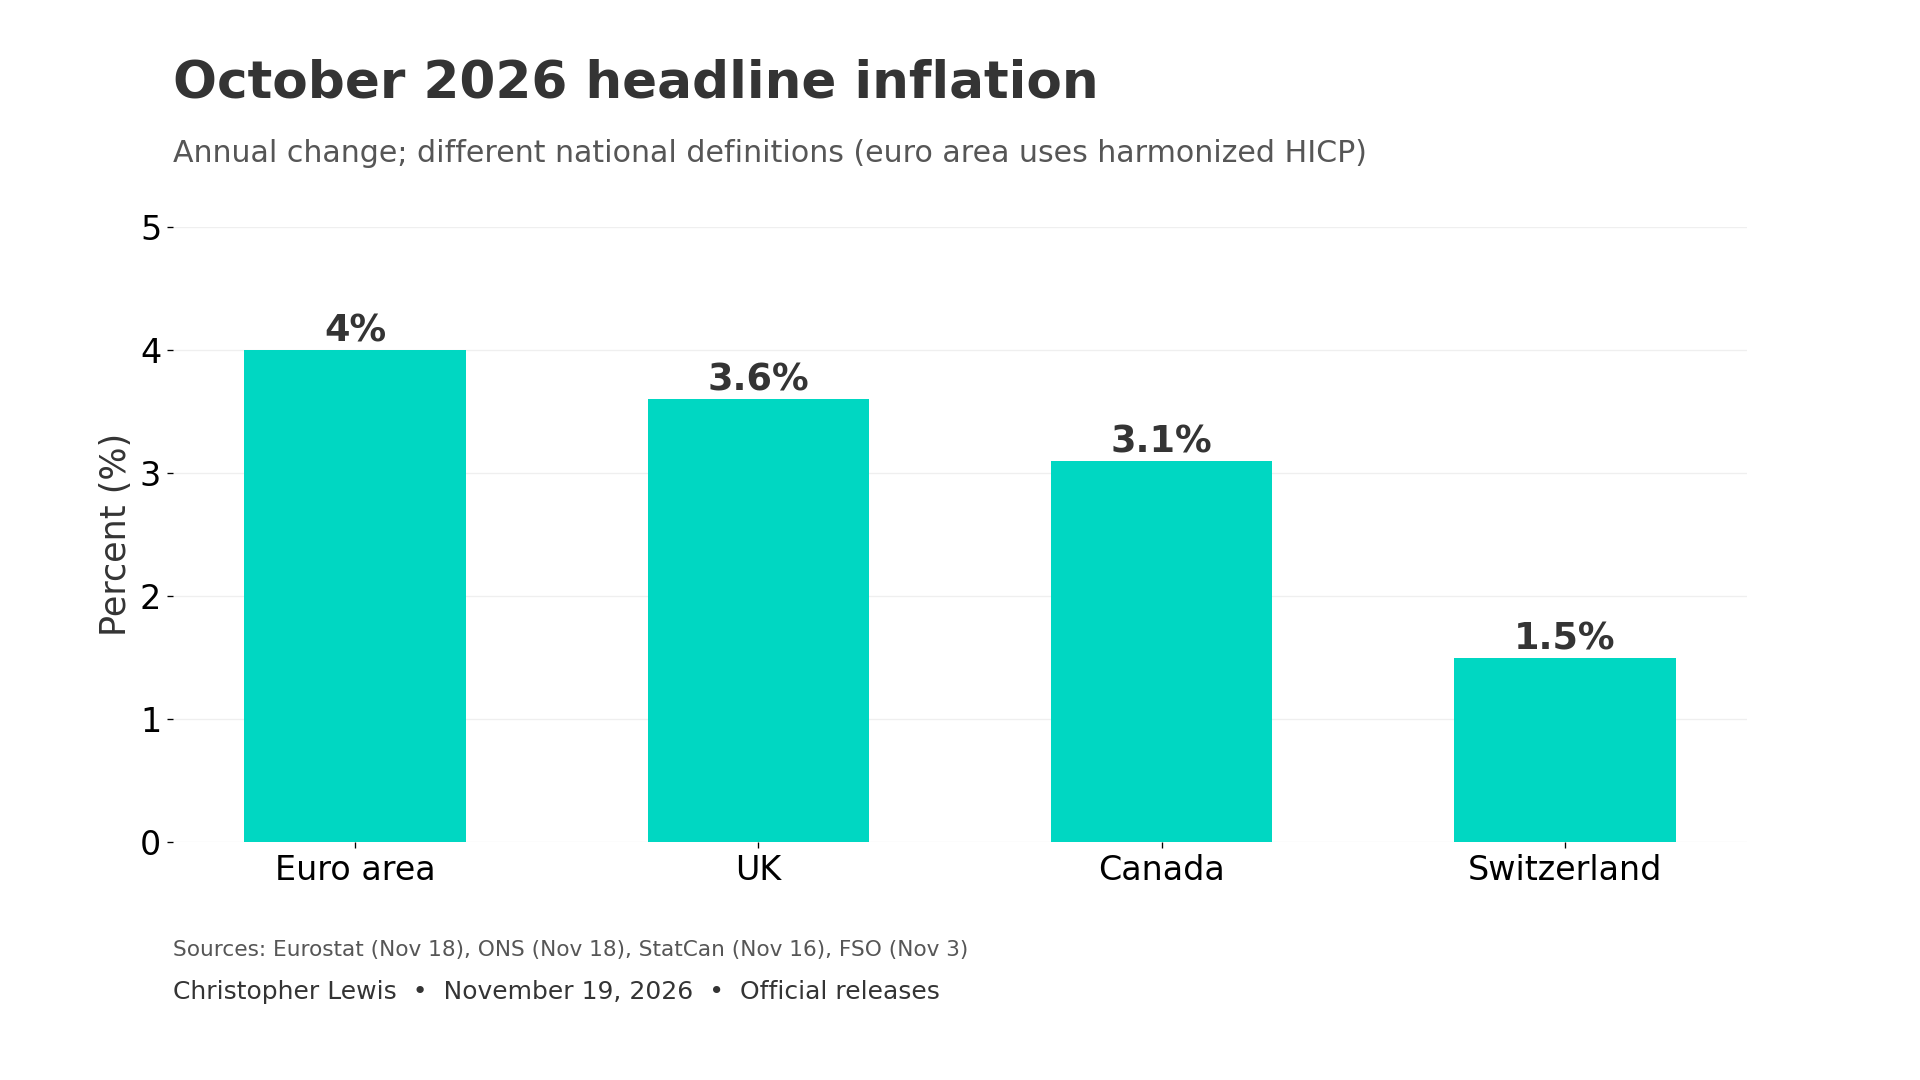
The euro has seen a little bit of a bounce during the early part of the session here on Thursday, as eurozone inflation reached 4%, released yesterday by Eurostat, compared to 3.8% in September. Guess what? It seems like nobody cares.
Part of this is due to the fact that energy prices increased 21% year over year, and it is contained and localized. At the same time, the market itself is watching the Federal Reserve, likely to raise rates next year. This is a big deal, and as a result, I still look at this as a fade-the-rally type of market.
1.10 is offering a little bit of short-term resistance, but I would prefer to short closer to 1.11. We’ll see if we get that opportunity, but I’ll be watching to see the price action today. Still a bearish market from what I can tell.
USD/CAD
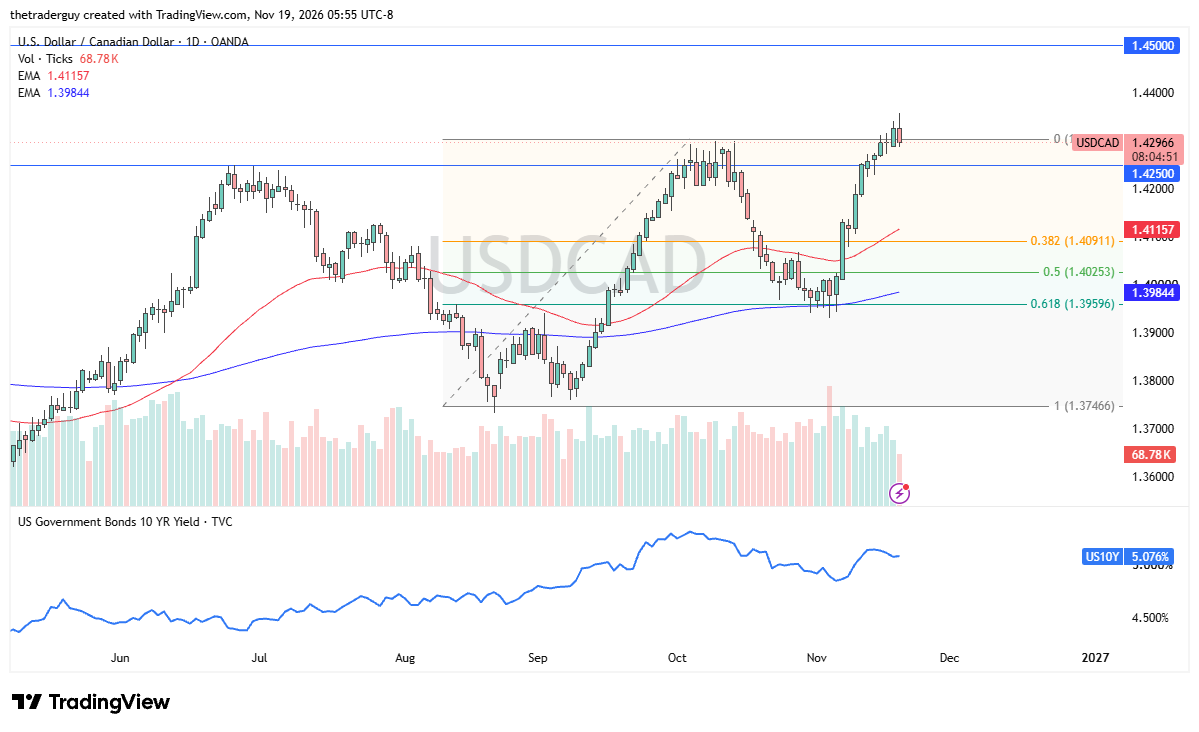
The Canadian dollar has clawed back some of its losses against the US dollar after the US dollar initially rallied during the trading session on Thursday. That does make a certain amount of sense, though. We just broke a pretty major barrier. Now we’re pulling back to test whether or not there’s any momentum there.
When you look at longer-term charts, there’s a lot of noise between 1.43 and 1.45. If you were watching me yesterday, or I think even the day before, I suggested that we probably go higher eventually, but it’s going to be tough sledding. It’s not a straight shot higher.
Keep in mind that Statistics Canada released data on November 16 showing CPI in Canada increased 3.1% year over year in October, staying the same as September. However, energy was a big part of that. In fact, inflation excluding energy slowed to 2%, right around what the Bank of Canada would be comfortable with. So this still looks like a Federal Reserve-driven type of pair. I remain bullish. I like buying dips.
USD/CHF
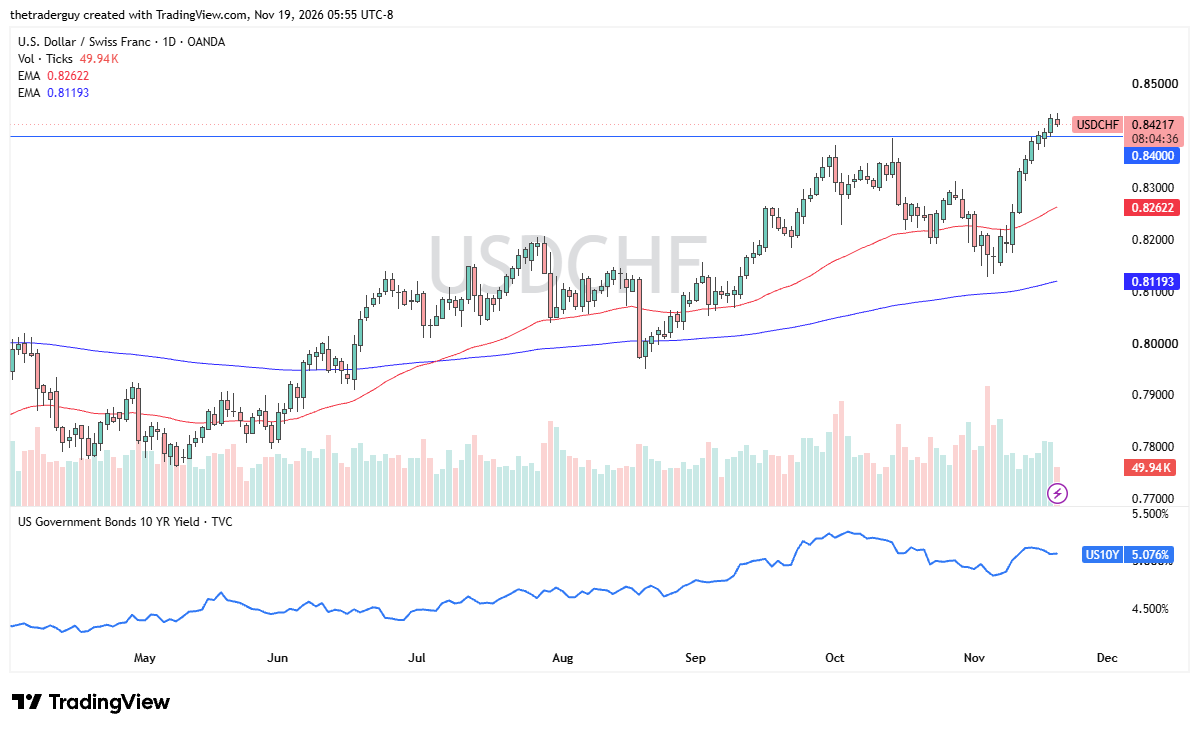
The US dollar has pulled back just a touch against the Swiss franc. Not a big deal. When you look at the move recently, much like in the euro and the Canadian dollar, this is simply a market that has gotten too far to one side. A short-term pullback does make a certain amount of sense here.
EUR/USD Price Forecast
Every new EUR/USD analysis as it publishes, today's technical signal and key levels, live price — on one page.
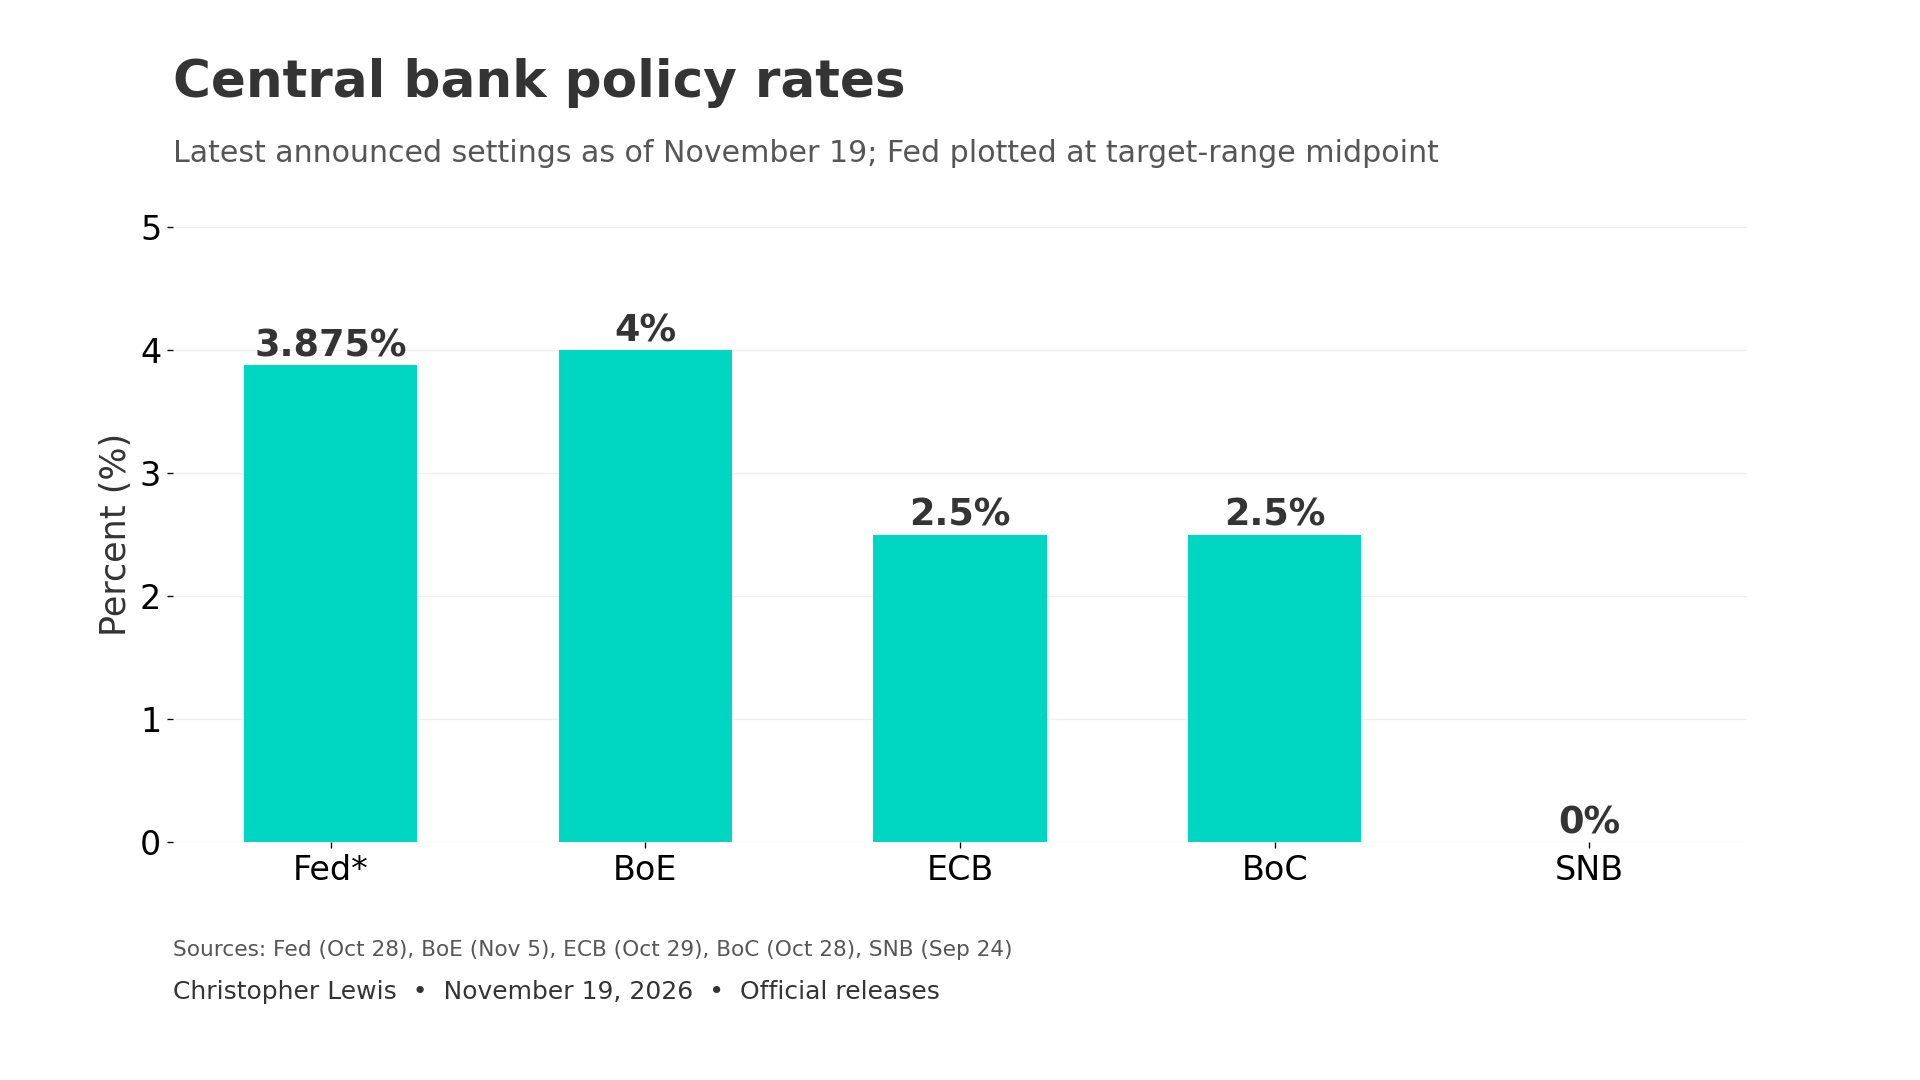
See all EUR/USD forecastsI’m willing to add to my position on those pullbacks because you get paid at the end of every day. The Swiss National Bank recently kept its policy rate at 0% during September’s monetary policy assessment, while the Federal Reserve has a range of 3.75% to 4.00% and is likely to raise by 25 basis points in a few weeks. I like the idea of buying dips, as usual.
GBP/USD
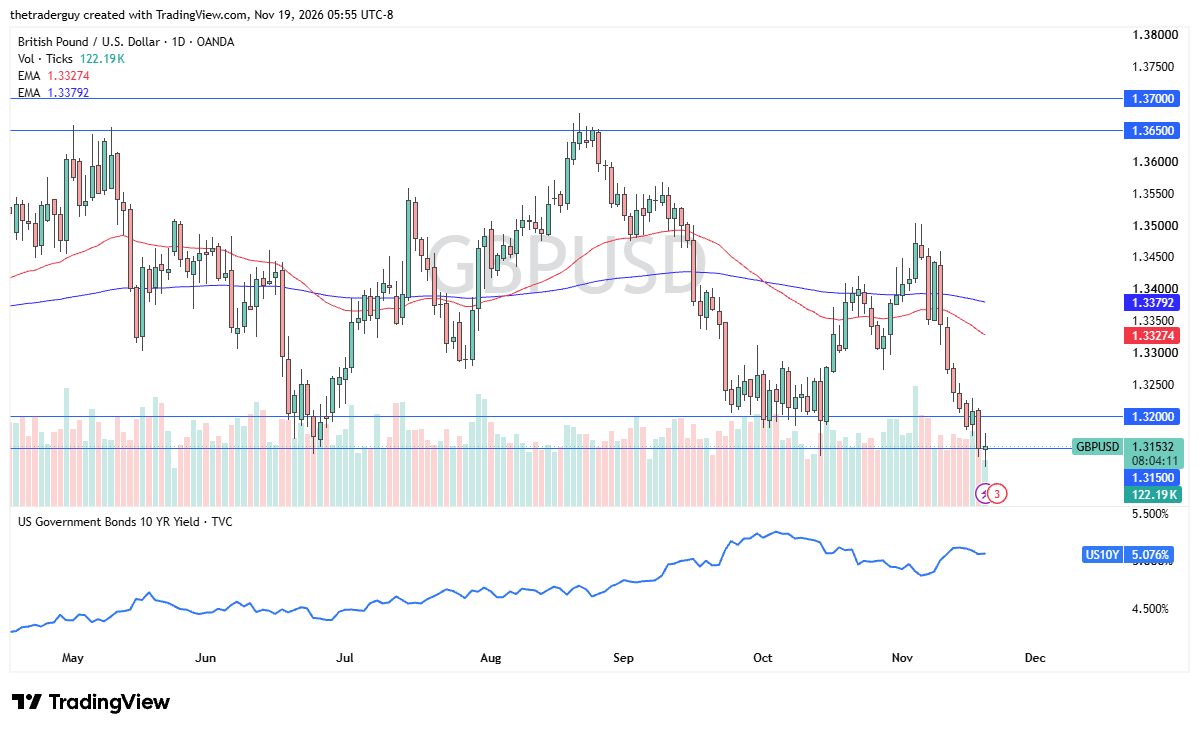
The British pound has fallen during the trading session and is testing major support. So the question then becomes: do we bounce from this area again after a breakdown like we did late last year, or does this lead to something a little bit more substantial to the downside?
The Office for National Statistics reported on November 18 that a consumer price inflation reading of 3.6% for October showed acceleration in comparison to 3.5% in September. Core inflation stood at 2.8%, while services inflation remained at 3.7%. Motor fuels were among the biggest contributors, though, so it’s kind of the same situation.
Ultimately, this is a market that is going to be watching the US dollar in general, but I would also point out that if the US dollar starts to give back some of its strength, this is the market I’m watching for a potential long. Selling still could work. Is it the next pair to fall? It could be, but there’s a lot of noise just below. So if it becomes an anti-dollar story suddenly, this is the first place I’m looking.