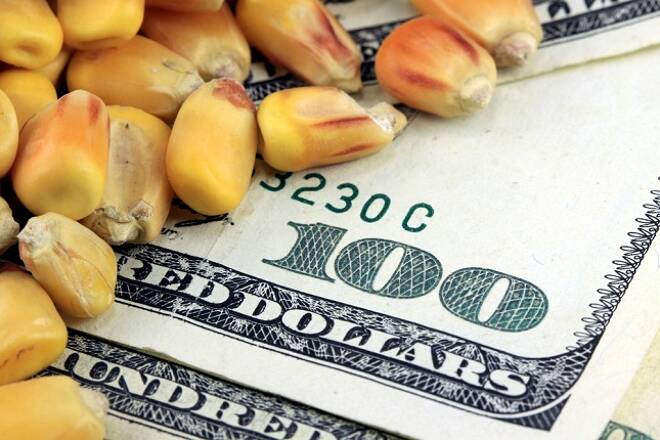
Soybean prices turned lower on Thursday as investors were unable to take the unit above the 20-day moving average. Corn is rallying for the ninth day in a row.
After a consolidation day on Wednesday, agricultural commodities are trading back to its previous mood. Investors are digesting speculations about the upcoming farm aid package that the White House would announce in the next days.
Soybeans failed to break above the 20-day moving average again, and it is now trading negative on the day. Corn completed its consolidation phase, and it resumed its uptrend. It is now testing the 3.900 area, Fresh highs since June 1st.
Wheat found support at 4.600 after rejecting the 200-day moving average area at 4.860. It is now trading above 4.700. Sugar is extending losses for the second day, and it is testing the 0.1120 level again.
As reported yesterday in FX Empire, “Donald Trump’s administration is considering a direct payment to US farmers of $2 per bushel for soybeans as an aid to offset problems caused by the trade war with China.”
The package would include $2 per soybean per bushel, and 63 cents per wheat bushel. According to the US Department of Agriculture, “the program is being designed to avoid skewing planting decisions one way or another.”
After a brief venture above the 20-day moving average level on Tuesday, Soybeans returned below the mentioned level on Wednesday, with the grain trading negative on Thursday as it is consolidating levels below.
Currently, Soybean prices are 0.67% negative on the day at 8.130, after the unit found support at 8.060 earlier in the day.
So, the oilseed remains in a range between 8.100 and 8.200, with the 20-day moving average now pressuring the unit to the downside at 8.196.
A break above the 20-day moving average will open the doors for a retest of the 8.350 area. Above there, 8.500, 8.640, and the 200-day moving average now at 8.700 are the most important resistances.
To the downside perspective, once the unit breaks the 8.100 area, it will test supports at 8.000 and 7.800.
After a brief period of consolidation from 3.890 to find support at 3.775 performed on Wednesday, Corn has resumed its rally with its prices jumping to reach fresh highs at 3.900. Corn is trading positive for the ninth day in a row.
Corn is currently trading at 3.891, 0.88% positive so far today. If the pair managed to extend gains above the 3.900 area, it would find resistances at 3.960 and 4.000 and near 3-year highs around 4.045.
Mauricio is a financial journalist with over ten years of experience in stocks, forex, commodities, and cryptocurrencies. He has a B.A and M.A in Journalism and studies in Economics by the Autonomous University of Barcelona. While traveling around the world, Mauricio has developed several technology projects focused on finances and communications. He is the inventor of the FXStreet Currency Poll Sentiment index tool.