Charts In trading, a chart is a picture which reflects the movements of a financial security plotted over time and each type of chart has its benefits as
Charts
In trading, a chart is a picture which reflects the movements of a financial security plotted over time and each type of chart has its benefits as well as drawback.
Line Chart
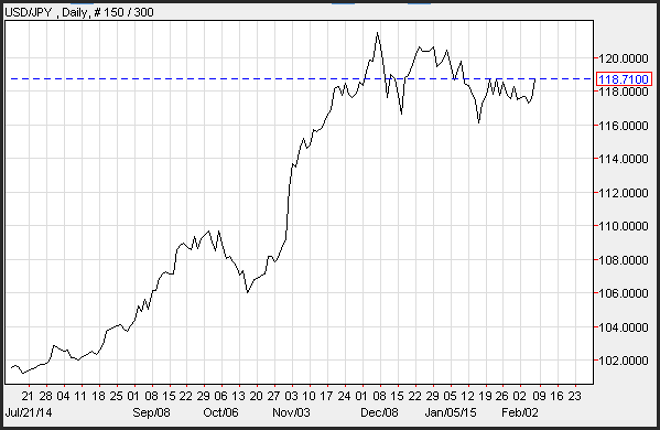
The most basic chart is a line chart. A line chart reflects one point during a specific period. The most common line chart shows the closing price of a financial security.
Drawbacks: Unfortunately, a line chart will only relay one point, which makes it difficult to determine support and resistance. During the course of a day, week or month, the highs and lows during those period could be substantially different from the closing price, making it difficult to see levels that show strong supply or robust demand for a security.
Benefits: A line chart is clean, and helps an investors eliminate the noise that is associated with charts that contain 2 or more points. Line charts are excellent for spreads between 2 instruments, such as the difference between gold and silver prices.
Bar Chart
Another type of chart is a bar chart. A bar chart, shows multiple points. The most common are the open, high, low, close / last. The opening price on a bar chart is generally designated by a small tab on the left side of the bar. The closing or last price is designated by a small tab on the right side of the bar. The high and the low points are self-explanatory.
A bar chart conveys a plethora of information, and is one of the most widely used charts. Many traders will eliminate either the open or the close or both, as the securities they trade are transacted around the clock and therefore the open and close are less important.
Drawbacks: The bar chart has a great deal of information and therefore can be very busy and generate unwanted noise.
Benefits: The bar chart reflects every point that occurs during the course of a trading period. It is very helpful in determining support and resistance levels. Many times traders will use bar chart highs points or bar chart low points to generate trend lines that reflects resistance and support levels.
Candlestick Chart
One of the most popular charts is the Candlestick chart. Candle stick charts allow investors to view the relationship between prices which describe current market conditions.
A Candlestick bar is derived from prices during the course of a day, which include a high, low, open and close. Candlesticks can be used on any time period, including monthly, weekly, daily and intra-day horizons. The body of the candlestick is the middle portion of the candle which the thin lines at the top and bottom are the tails.
Using a chart is an important tool to help an investor view the historical movements of a security which can only assist in helping predict future price movements.
Candlesticks bars will create an impression of market conditions which can be viewed by the color or pattern created by one or more bars. When a security closes higher than the opening price, the body of the candle is blue or (uncolored). The top of the body is the closing price and the bottom of the body represents the opening price. When a security closes below the opening price the body of the candle is red or (colored).
Drawback: There is a lot of information on a candlestick chart which creates noise.
Benefits: Candlesticks reflect a more complete picture of price action compared to a standard bar chart or a line chart. The relationship between the open and close as well as the high and low, allows an investors to envision where prices moved through a day (or week/month).