Every Thursday the Department of Energy releases its estimate of inventories for natural gas storage supply in the United States.
This number is widely speculated on by analysts and natural gas prices will move rapidly if the number is different than expectations. The number is released at 10:30 ET on Thursday unless there is a holiday earlier in the week.
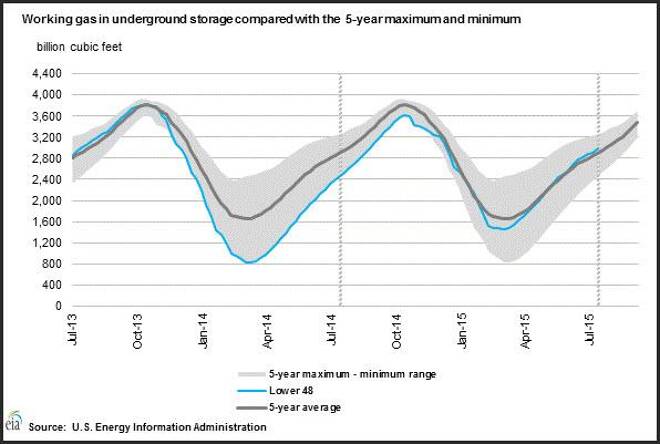
The Energy Information Administration will release its storage report and release statistics that show how inventories are performing relative to the 5-year range. The graph below shows a picture of natural gas stocks, and how much storage is available relative to the 5-year maximum and minimums along with the 5-year range.
The summary of the information will look something like this. “Working gas in storage was 2,977 Bcf as of Friday, August 7, 2015, according to EIA estimates. This represents a net increase of 65 Bcf from the previous week. Stocks were 521 Bcf higher than last year at this time and 81 Bcf above the 5-year average of 2,896 Bcf.
In the East Region, stocks were 61 Bcf below the 5-year average following net injections of 53 Bcf. Stocks in the Producing Region were 124 Bcf above the 5-year average of 975 Bcf after a net injection of 7 Bcf. Stocks in the West Region were 17 Bcf above the 5-year average after a net addition of 5 Bcf. At 2,977 Bcf, total working gas is within the 5-year historical range.”
What is generally important is the total working gas in storage and the change from week to week. The consuming region is also very important, it is reflects how much demand is coming on line. The EIA will also produce news items that discuss rig count as well as interruptions in production. For example, “The total U.S. oil and gas rotary rig count rose by 10 units to 884 for the week ending Friday, August 7, according to data from Baker Hughes Incorporated. The oil rig count increased by 6 units to 670, and the natural gas rig count increased by 4 to 213 units. Total rigs are currently 1,024 units below their year-ago levels.”
Looking at the long term ranges of natural gas prices relative to the inventories in storage will give you an idea of the historical pricing of natural gas around specific storage levels.
David Becker focuses his attention on various consulting and portfolio management activities at Fortuity LLC, where he currently provides oversight for a multimillion-dollar portfolio consisting of commodities, debt, equities, real estate, and more.