Forex traders are always looking for new trading techniques to increase their odds at successful trading opportunities.
Technical analysis tools which are used quite frequently in forex trading and utilized to find support and resistance levels are Bollinger Bands. The forex markets are constantly changing and when utilizing a forex trading strategy which can assist the forex trader from increasing their opportunities they will typically embrace these strategies.
Bollinger Bands were created/invented by John Bollinger. John Bollinger has a strong background in the financial markets. Bollinger was the chief market analyst for several years with the Financial News Network.
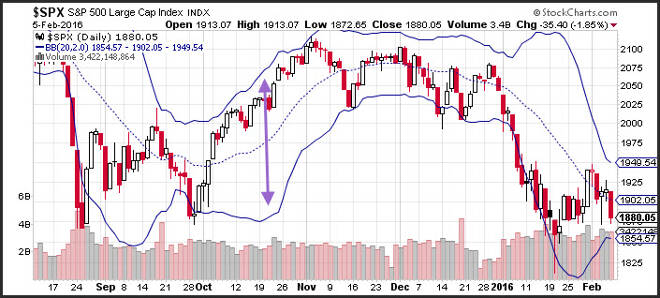
In addition, Bollinger’s primary responsibility while working with the network was technical analysis content which was broadcasted on the air. The purpose of the Bollinger Band is to provide a technical analysis strategy by providing the user with a twenty day moving average. In addition, the Bollinger Bands provide support and resistance levels which measure two standard deviations above as well as below the twenty day moving average.
The beauty behind Bollinger Bands is that they are very strong at locating trends as well as reversals. From a technical point of view one of the most important features of Bollinger Bands is that when markets tend to slow down and there is little volatility both the upper as well as the lower bands come close together. It is important to note that when the markets slow down and the Bollinger Bands show a narrow range it is possible that a breakout is occurring and with this a big trend could be on the way.
One of the best ways to utilize Bollinger Bands is to find a range and then sit on this range for it to breakout. Bollinger Bands are fantastic when it comes to trend following.
Traders who utilize Bollinger Bands vary across the board. Some traders buy when price action touches the lower Bands and then exit when the price action touches the moving average which is located in the center of the bands. Conversely, other traders will buy when price action goes through the upper bands and or sell when price action drops below the lower band.
Forex traders typically utilize Bollinger Bands with other technical indicators to recognize price action. For example, the use of oscillators will usually be utilized with non oscillator such as trend lines. If/when these indicators establish the utilization of the Bollinger Bands; the forex trader will have a stronger conviction that the Bollinger Bands are forecasting correct pricing as it relates to market volatility.
So, just how effective are Bollinger Bands? There have been numerous studies on the effectiveness of Bollinger Bands. Analysts who had participated in studies dating back decades found no proof or evidence of consistent representation as it relates to a buy and hold approach.
In closing, Bollinger Bands are utilized quite frequently amongst the forex trading community. Many traders believe that Bollinger Bands when utilized correctly can be an extremely valuable tool. Bollinger Bands are presently utilized with other technical analysis tools and overall are a valuable resource for forex traders.
David Becker focuses his attention on various consulting and portfolio management activities at Fortuity LLC, where he currently provides oversight for a multimillion-dollar portfolio consisting of commodities, debt, equities, real estate, and more.