ADA, DOT, ETH, and SOL Weekly Review – A Dovish Fed Delivers
It has been a bullish week for the crypto market, which is on target to end a 3-month losing streak. DOT leads the way in the current week.Key Insights:
- Crypto investor sentiment towards Fed monetary policy took a U-turn, with a dovish Fed rate hike and US economic indicators delivering support.
- Network news updates were mixed. While Ethereum Merge updates were positive, the Cardano (ADA) Vasil hard fork got delayed.
- Technical indicators are bullish, with the EMAs signaling more upside ahead.
It has been a bullish final week of July, with US economic indicators, the US Federal Reserve, and US Corporate earnings directing the broader crypto market.
On Wednesday, the Fed delivered a ‘dovish’ 75 basis point rate hike that drove demand for riskier assets. In response to Fed Chair Powell’s forward guidance, hopes of a slower pace of interest rate hikes delivered the shift in sentiment.
US second quarter GDP numbers added further support on Thursday. The US economy contracted by 0.9% following a 1.6% contraction in the first quarter, leading to the markets pricing out a 75-basis point rate hike in September.
At the end of the week, US inflation and personal spending figures left the crypto market flat-footed going into the weekend.
US corporate earnings drew plenty of attention, with Microsoft (MSFT), Walmart (WMT), Amazon (AMZN), and Apple (AAPL) in focus.
This week, Walmart spooked investors with a gloomy outlook before Microsoft, Apple, and Amazon delivered much-needed support.
All three delivered positive earnings outlooks, delivering the NASDAQ 100 the bullish end of the month.
The NASDAQ 100 rallied by 12.35% in July.
There was also more jostling in the SEC v Ripple case, with SEC filing its objection to the court ruling on the Hinman speech-related docs.
However, crypto network updates were mixed in the week. While progress towards the Ethereum Merge continued, the Cardano (ADA) Vasil hard fork got pushed into August.
This week, Polkadot (DOT) is leading the way, currently up 11.22%. While ETH (+6.20%) and SOL (+6.03%) also found strong support, ADA (+3.71%) trailed the pack.
Cardano ADA
For the current week, Monday through Sunday morning, ADA was up 3.71% to $0.5311. A bearish start to the week saw ADA slide to a Tuesday low of $0.4509 before striking s Saturday high of $0.5556.
Steering clear of the May 12 current-year low of $0.3919, ADA struck a new July high before easing back.
For Cardano, the Vasil hard fork delay limited the upside going into Sunday.
On a trend analysis basis, ADA would need to move through the July high of $0.5556 to target the June high of $0.6688.
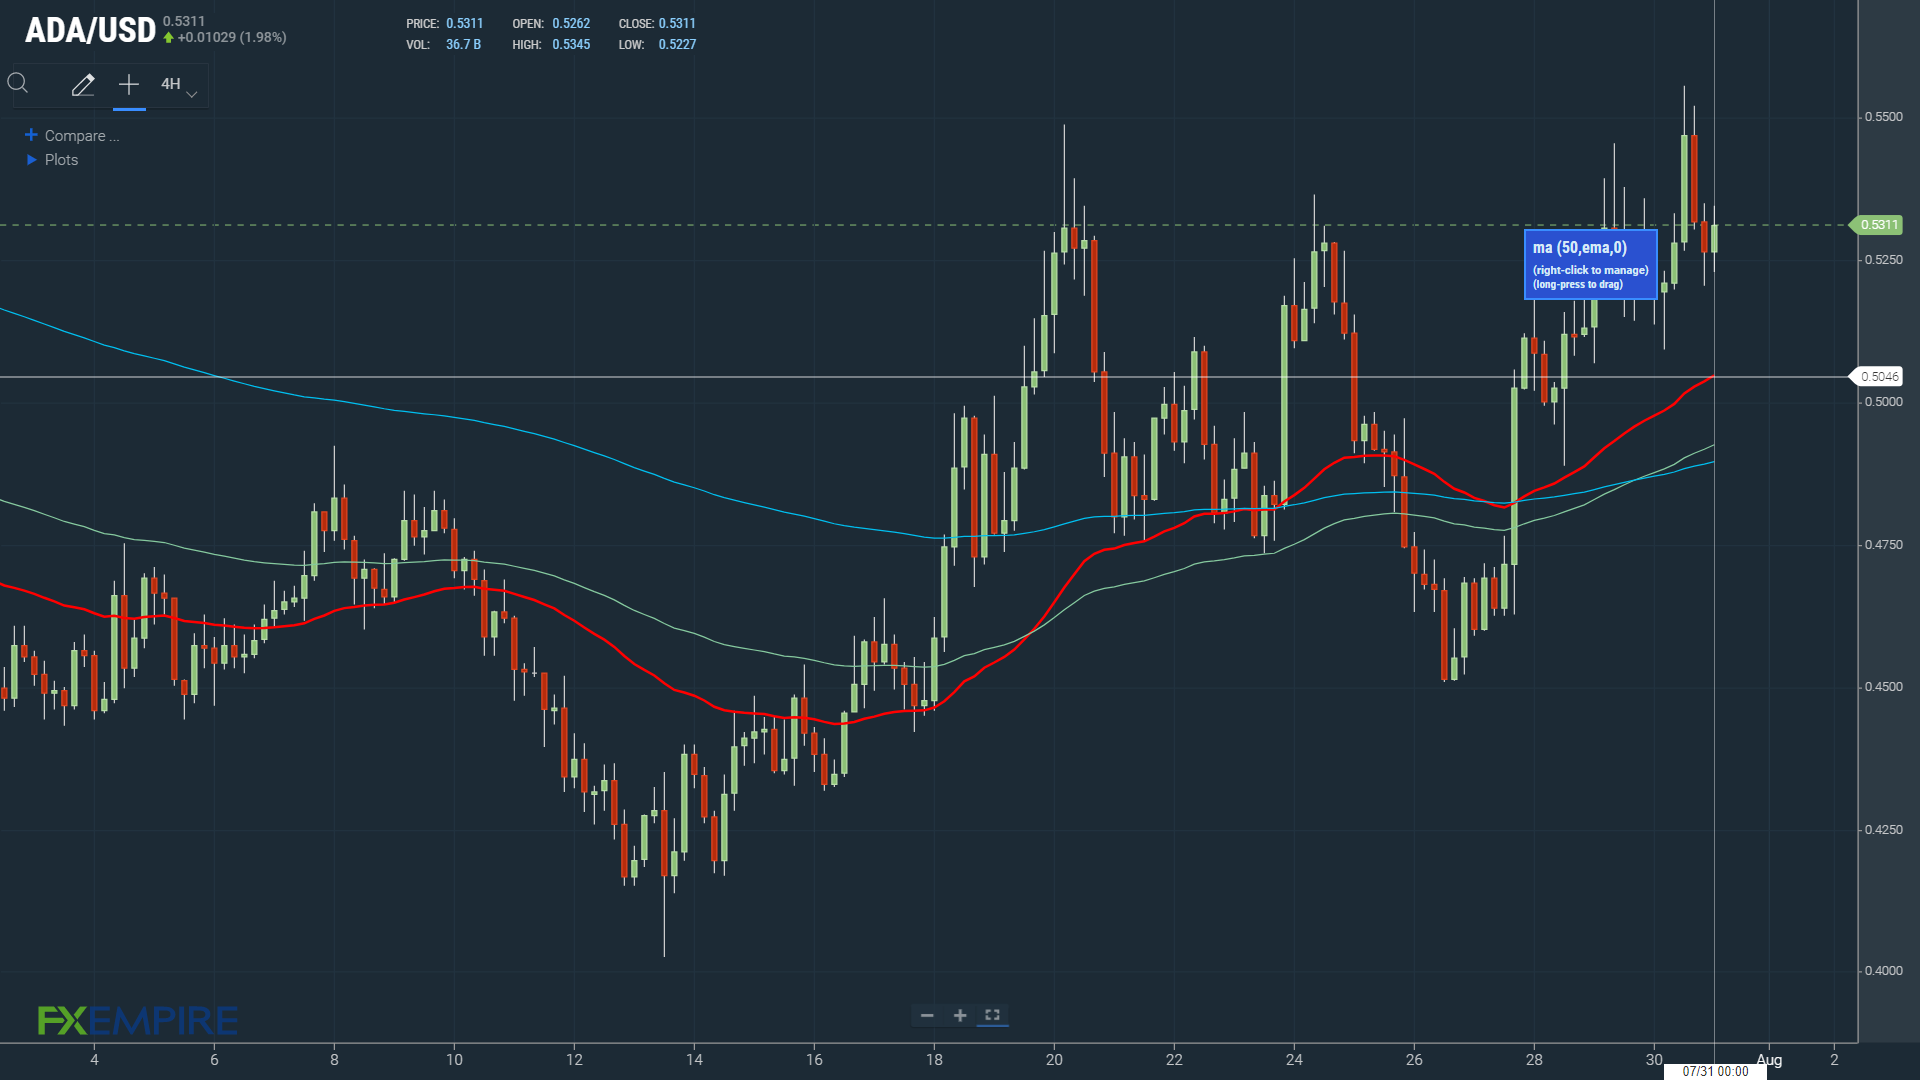
Looking at the EMAs, based on the 4-hourly, it was a bullish signal. The 50-day EMA pulled away from the 100-day EMA. Following Friday’s bullish cross, the 100-day EMA also broke clear from the 200-day EMA, ADA price positives
A further widening of the 50-day EMA from the 100-day and 200-day EMAs would support a run at the June high.
However, ADA would need to hold above the 50-day EMA, currently at $0.5046, to support the near-term bullish trend.
Polkadot (DOT)
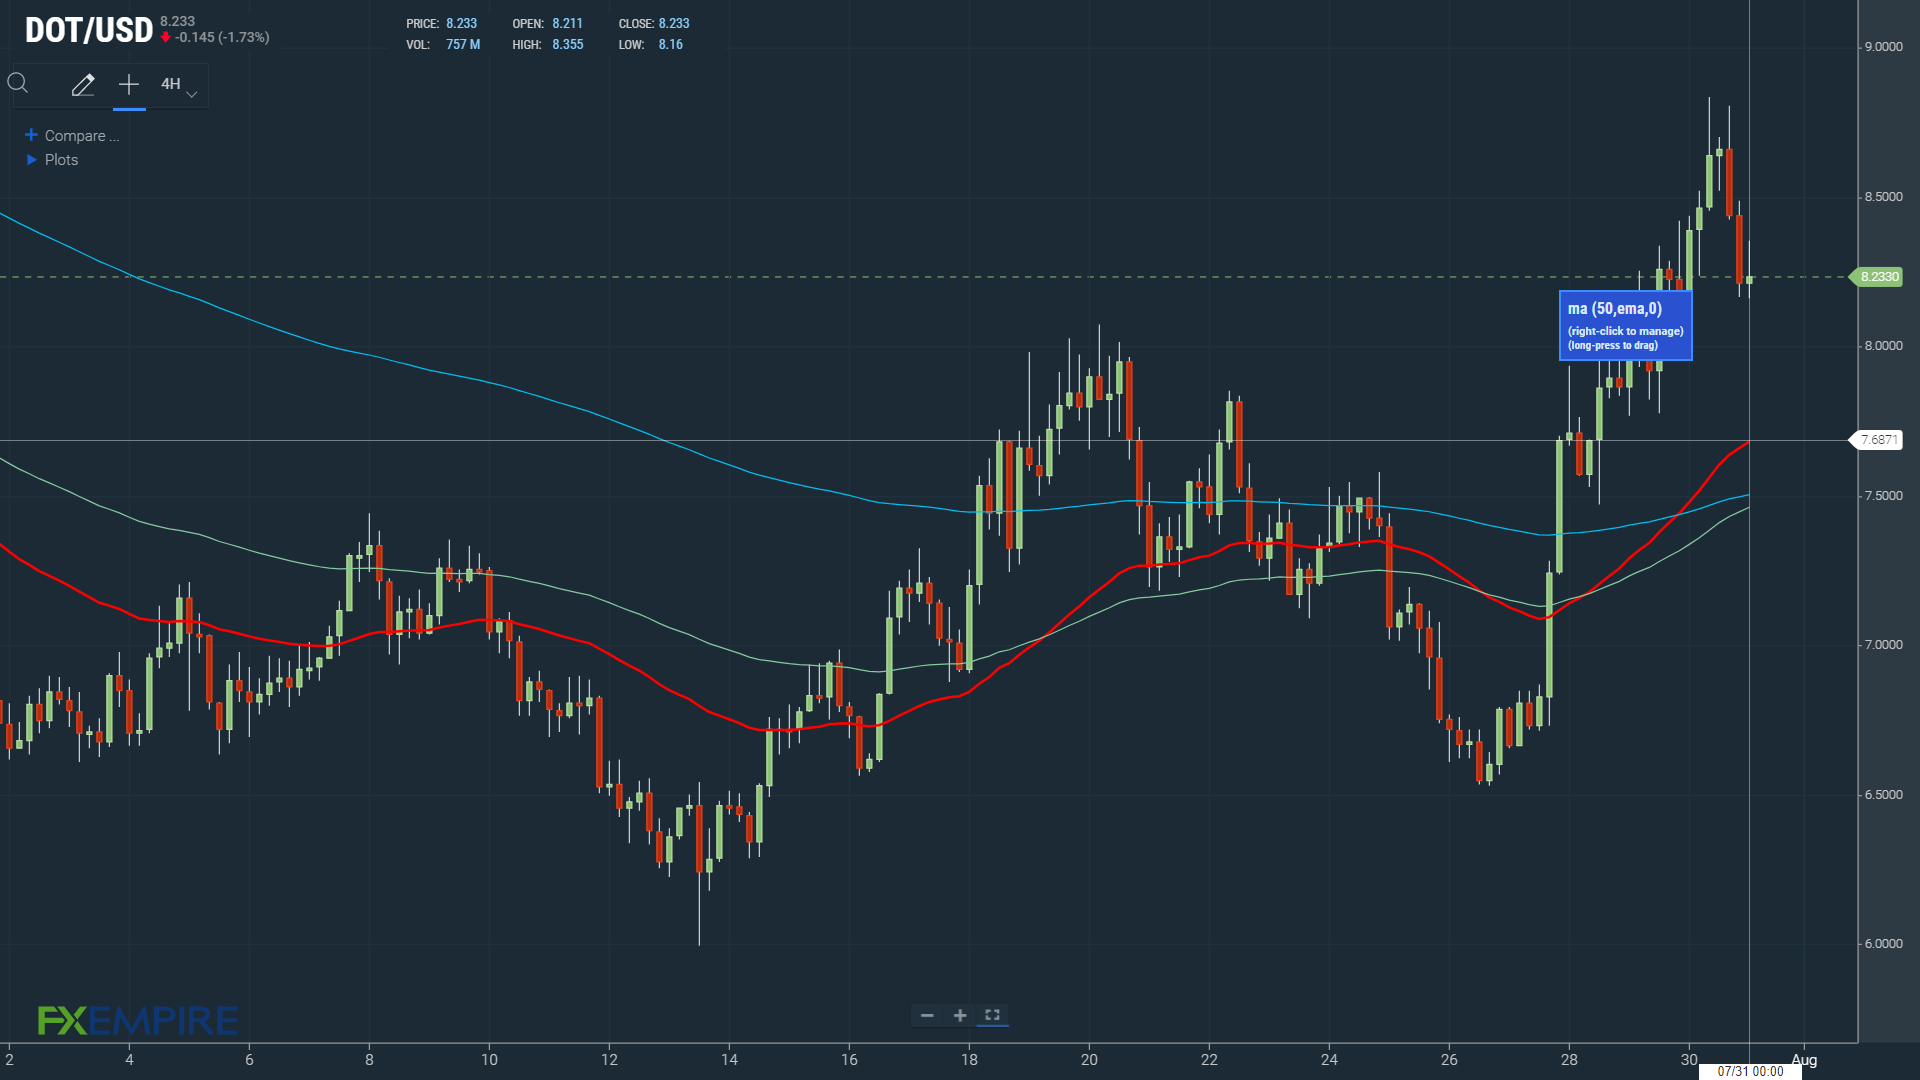
Monday through Sunday morning, DOT is up 11.22% to $8.23. Tracking the broader market, DOT fell to a Tuesday low of $6.53 before striking a Saturday and a new July high of $8.84.
News of Moonbeam integrating with Axelar and Osmosis to support token transfers between Polkadot and Cosmos contributed to the upside.
Looking at the trends, DOT returned to $8.80 for the first time since June 11. A breakout from the week high of $8.84 would give the bulls a free run at the June high of $10.73.
In the event of an extended reversal, steering clear of sub-$6.00 and the June and current-year low of $5.99 remains the key.
Looking at the EMAs, based on the 4-hourly, the signal was bullish. DOT sat above the 50-day EMA, currently at $7.6871. Following the Friday bullish cross, the 50-day EMA pulled away from the 200-day EMA. The 100-day EMA closed the gap on the 200-day EMA, both DOT price positives.
A bullish cross of the 100-day EMA through the 200-day EMA would support a run at $10.00. However, DOT needs to avoid the 50-day EMA to deliver a breakout from 8.84.
Ethereum (ETH)
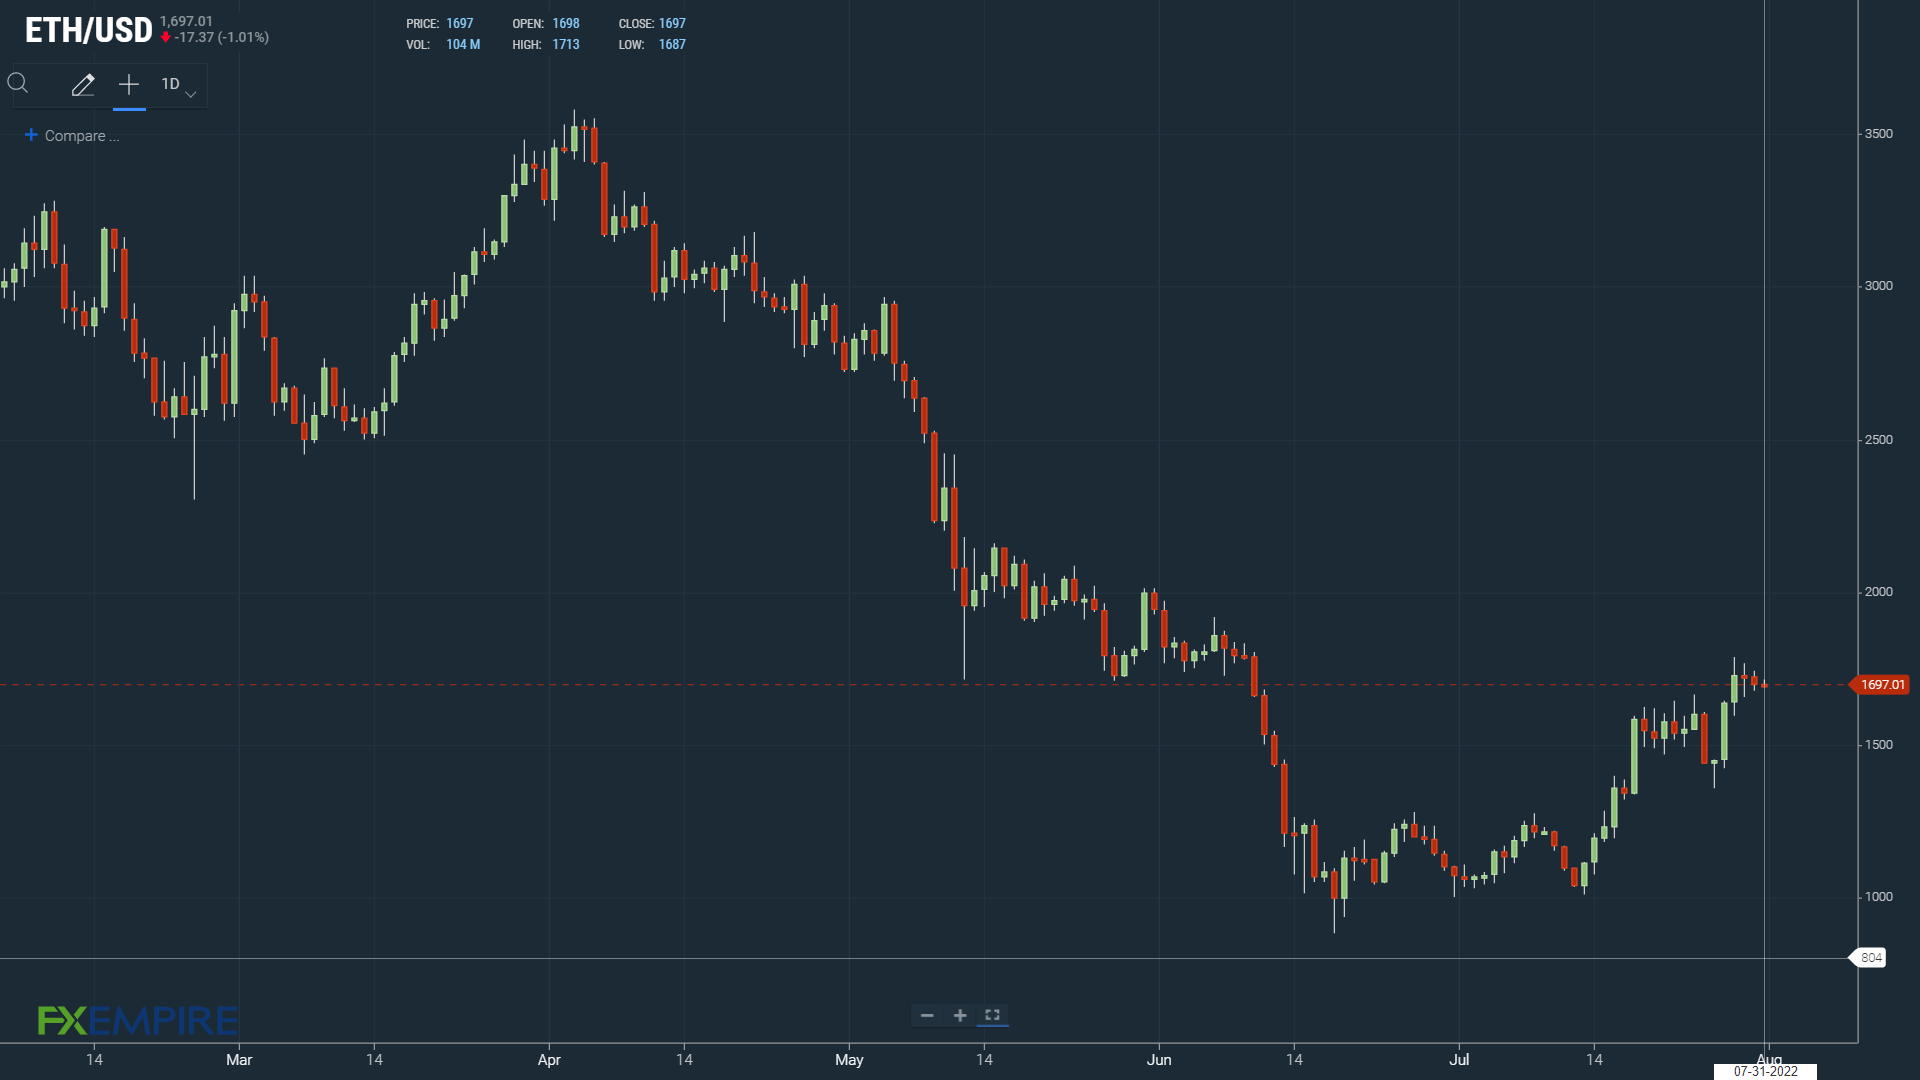
For the current week, Monday through Sunday morning, ETH was up by 6.20% to $1,697. Progress towards the Merge took a backseat this week. Apprehension ahead of the Fed monetary policy decision led ETH to a Tuesday low of $1,357.
The dovish rate hike and US economic contraction in the second quarter drove ETH to a Thursday high and a new July high of $1,788.
However, a pullback going into the weekend has left ETH at sub-$1,700.
For Ethereum, news updates on the Merge will remain the key driver, though price volatility may pick up ahead of US private sector PMIs next week.
Looking at the trends, ETH would need a breakout from the week high of $1,788 to target the June high of $1,972 and $2,000.
However, downside risks remain should developers announce a delay to the September Merge.
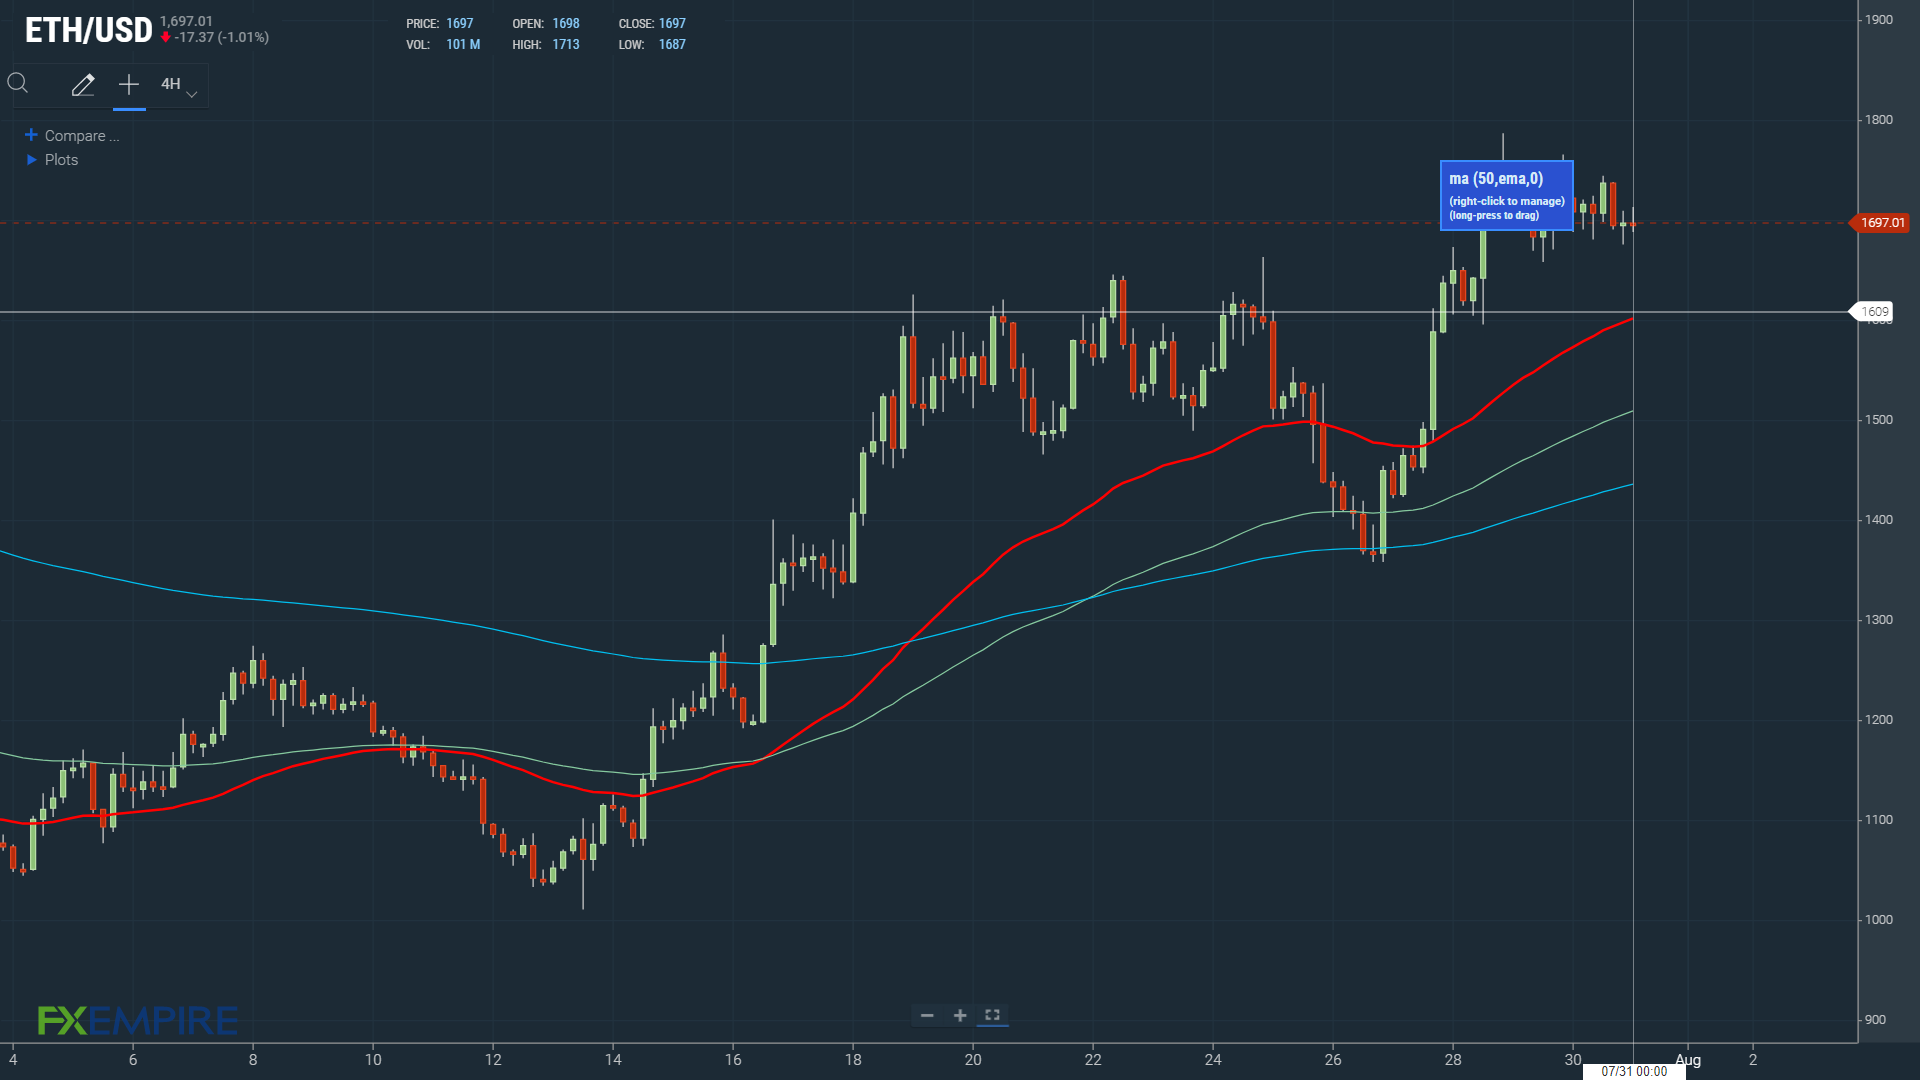
Looking at the EMAs, based on the 4-hourly, it was a bullish signal. ETH sat above the 50-day EMA, currently at $1,609. The 50-day EMA pulled away from the 100-day EMA, with the 100-day EMA also breaking out from the 200-day EMA, both ETH price positives.
A further widening of the 50-day EMA from the 100-day EMA would deliver another breakout week.
However, a fall through the 50-day EMA could see ETH test support at the 100-day EMA, currently at $1,500.
Solana (SOL)
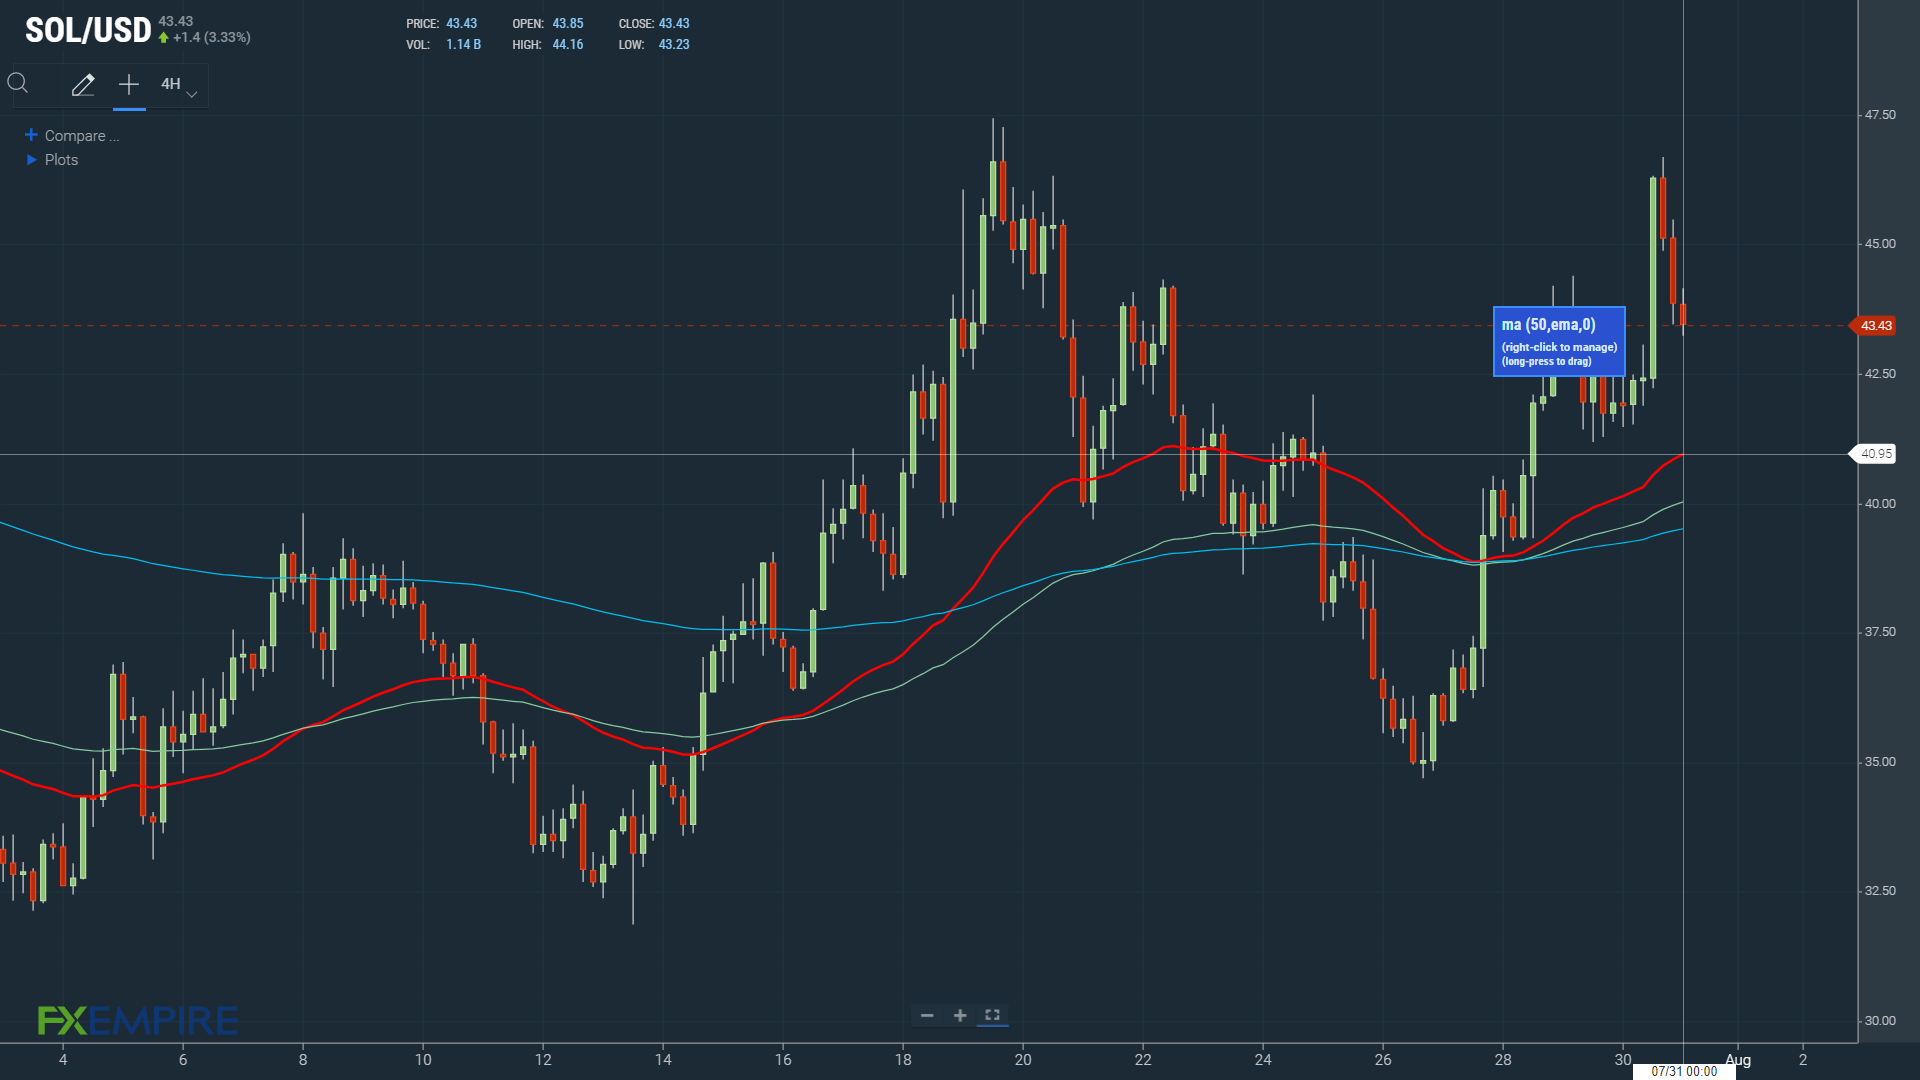
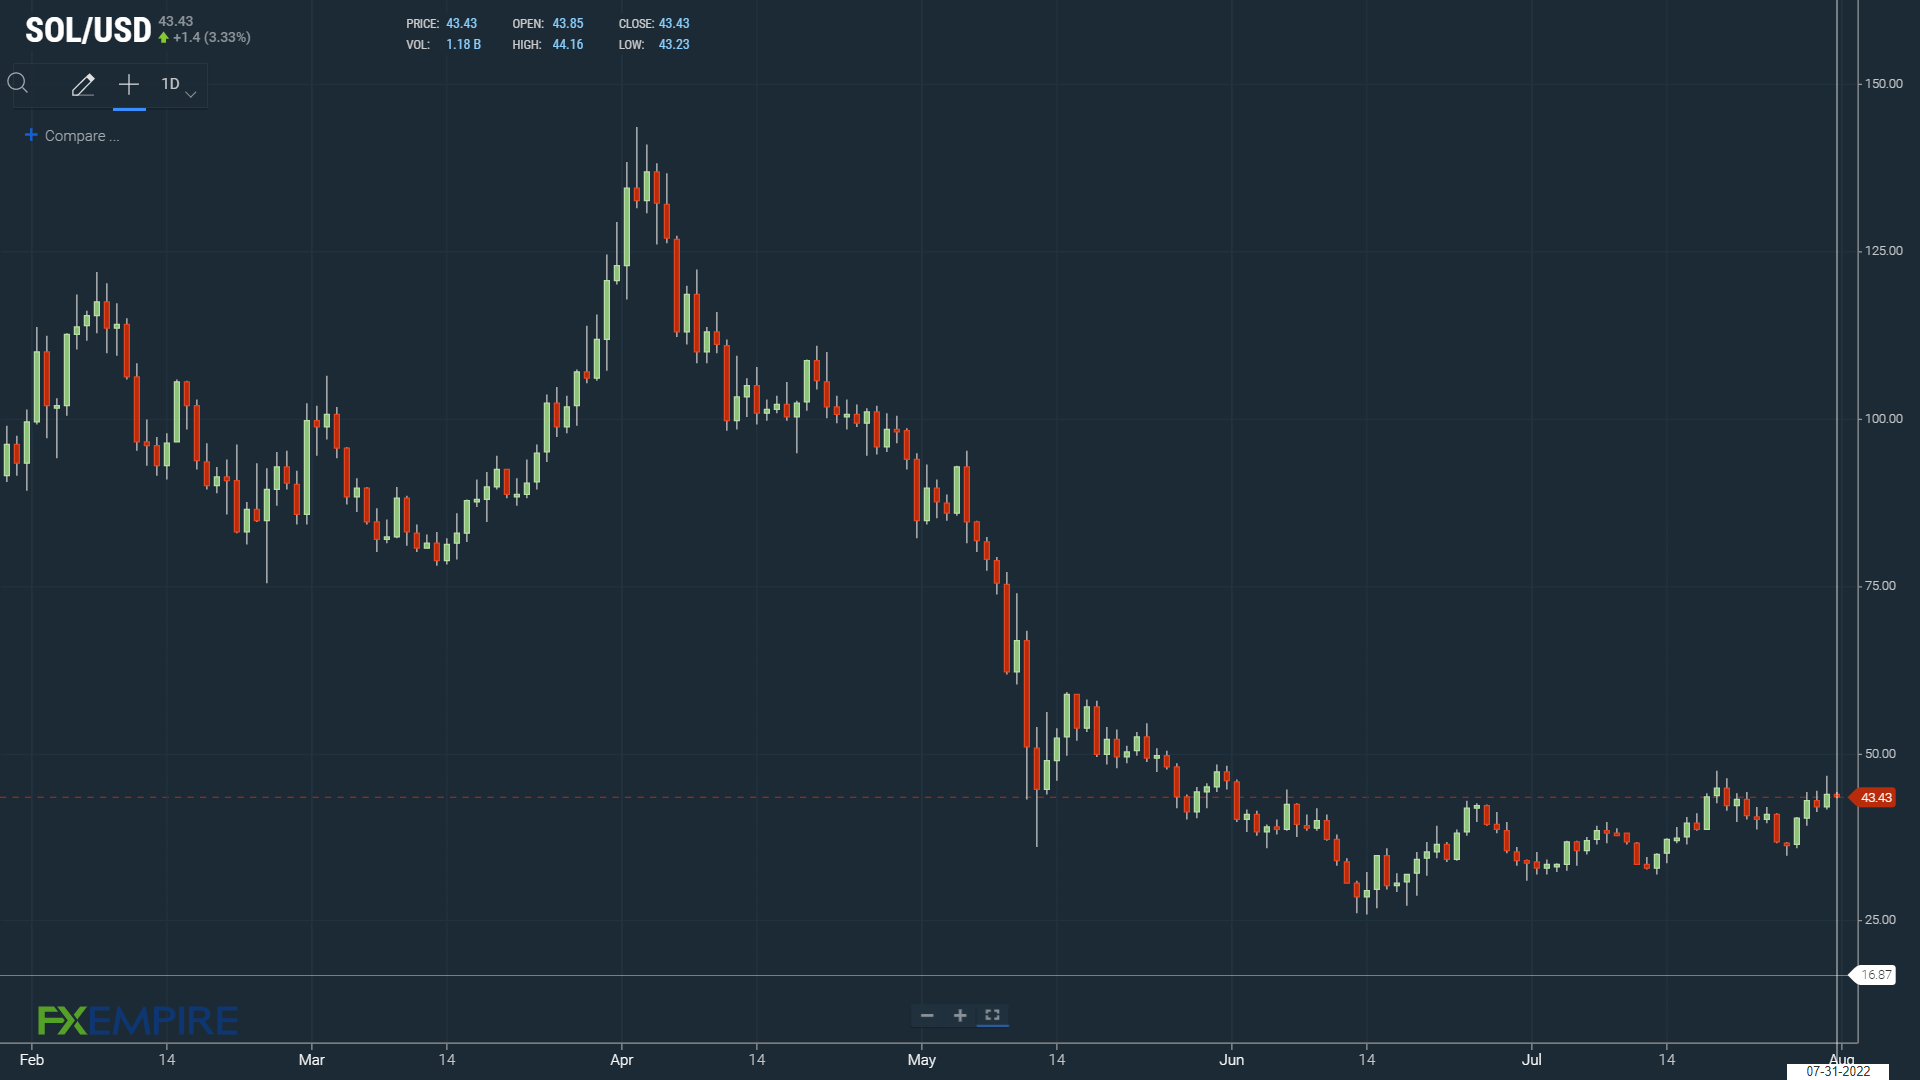
Monday through Sunday morning, SOL is up 6.03% to $43.43. Tracking the broader market, SOL fell to a Tuesday low of $34.68 before striking a Saturday high of $46.68.
However, responding to a broad-based crypto pullback, SOL fell back to sub-$44.
Following the recent Solana Mobile updates, there were no key drivers to deliver additional direction.
Looking at the trends, Solana fell short of the July high of $47.45. A move through the July high would support a run at the June high of $46,10 to bring $50 into play.
For the bulls, a return to $50 would give SOL a free run at the May high of $95.17.
In the event of another extended reversal, avoiding sub-$25 and the June and current-year low of $24.84 remains the key.
Looking at the EMAs, based on the 4-hourly, it was a bullish signal. SOL sat above the 50-day EMA, currently at $40.95.
The 50-day EMA pulled away from the 100-day EMA, with the 100-day EMA breaking clear of the 200-day EMA, both SOL price positives.
The 50-day EMA would need to widen from the 100-day EMA to bring $50 into play.
However, SOL must avoid the 50-day EMA. A fall through the 50-day EMA would bring the 100-day EMA, currently at $40, and sub-$40 into play.
