AUD/USD and NZD/USD Fundamental Analysis: Aussie Trade in Focus
It is a relatively quiet day for the AUD/USD. Aussie trade data will provide direction ahead of US labor market stats later in the day.
It is a quieter Thursday session for the AUD/USD and NZD/USD. Economic indicators from Australia will put the Aussie dollar in focus this morning,
Trade data for April will move the dial. Following the unexpected slump in China exports, weak exports would support the view that the global economy is beginning to show the effects of synchronized central bank interest rate hikes.
Economists forecast the Aussie trade surplus to narrow from A$15.269 billion to A$14.000 billion.
However, there are no economic indicators from New Zealand or China to influence the Kiwi Dollar, leaving market risk sentiment to provide direction. China stimulus chatter would be Kiwi dollar price positive.
Looking towards the US session, it is a busier session. Initial jobless claims figures will draw interest. With hiring continuing to impress, a sharp increase in jobless claims would support a more dovish Fed pause in June. However, economists forecast jobless claims to increase from 232k to 235k.
AUD/USD Price Action
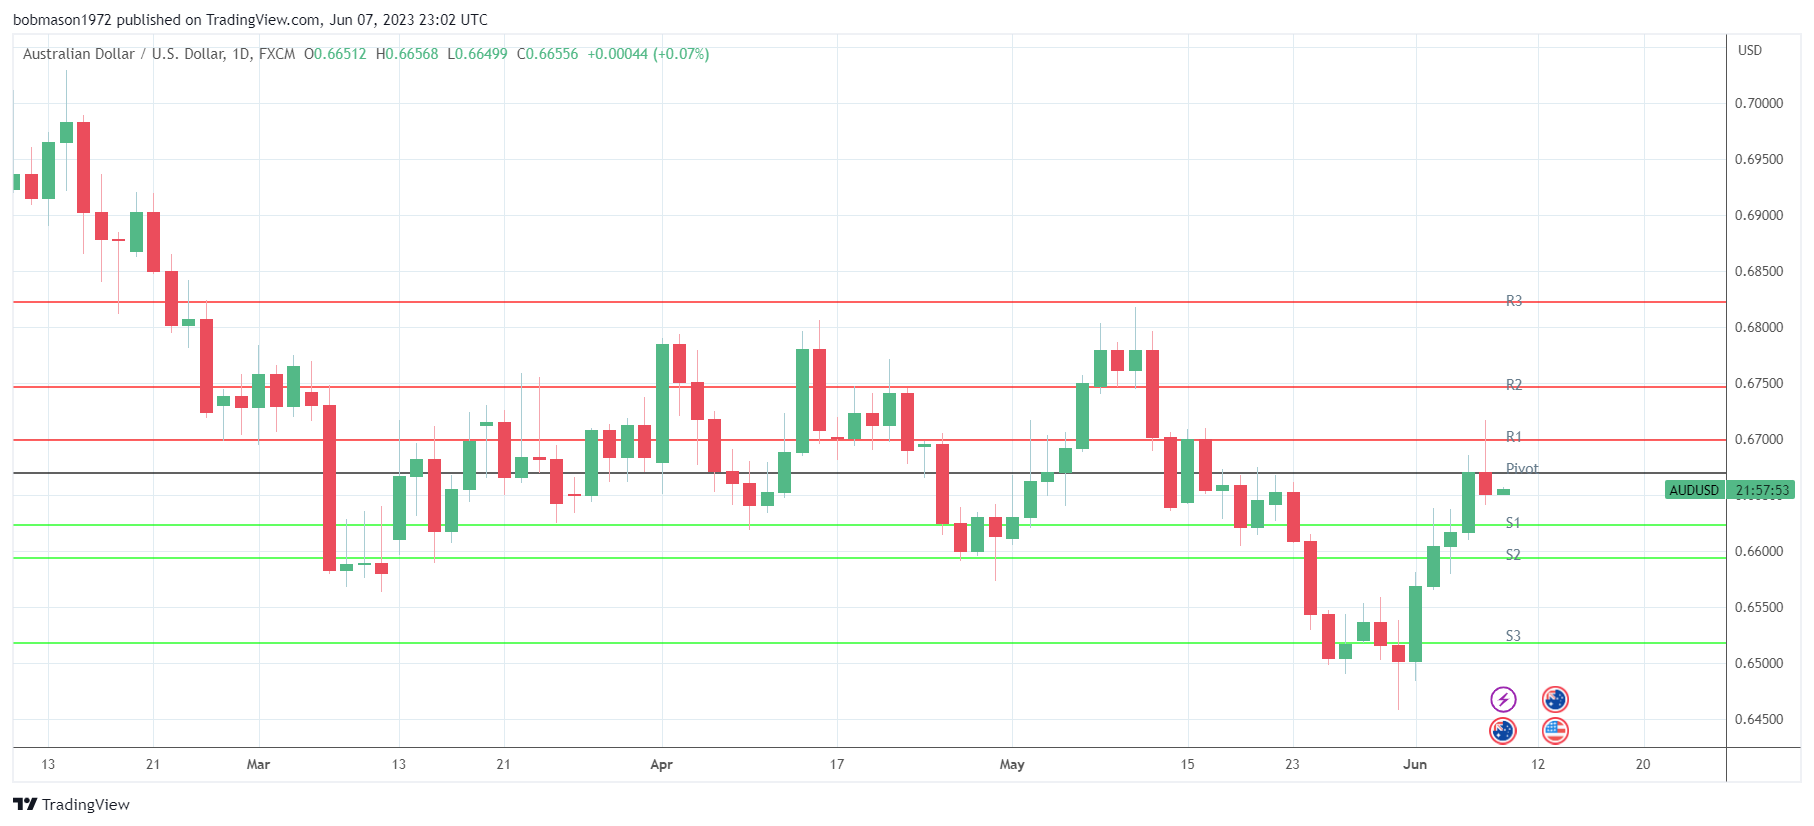
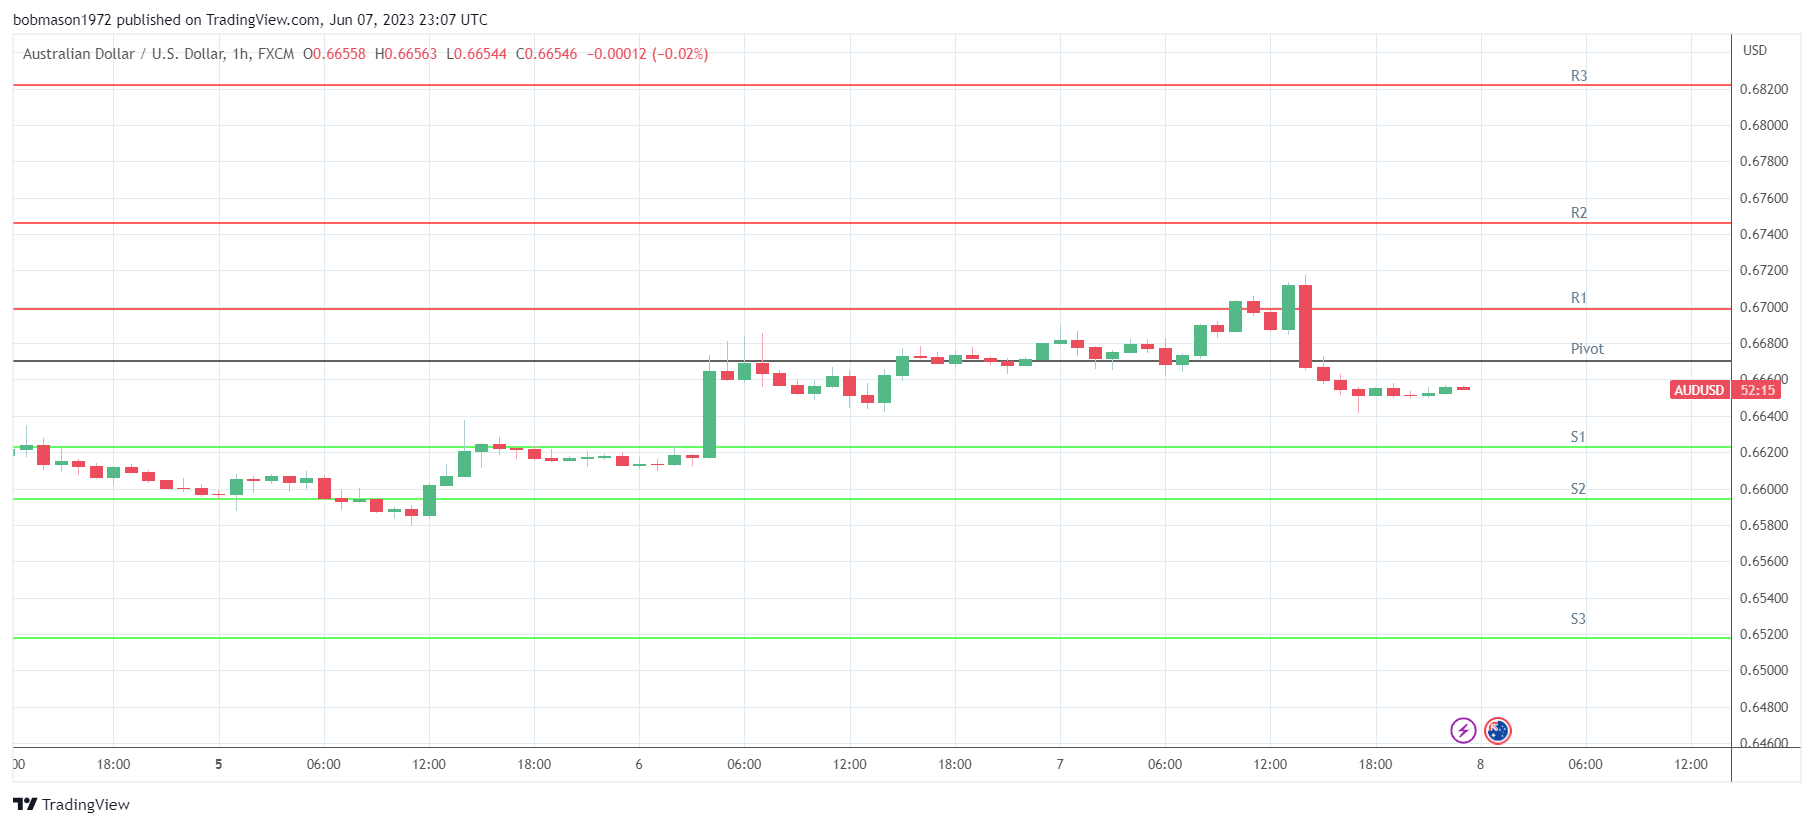
This morning, the AUD/USD was up 0.07% to $0.66556. A mixed start to the day saw the AUD/USD fall to an early low of $0.66499 before rising to a high of $0.66568.
Technical Indicators
Resistance & Support Levels
| R1 – $ | 0.6699 | S1 – $ | 0.6623 |
| R2 – $ | 0.6746 | S2 – $ | 0.6594 |
| R3 – $ | 0.6822 | S3 – $ | 0.6518 |
The AUD/USD needs to move through the $0.6670 pivot to target the First Major Resistance Level (R1) at $0.6699 and the Wednesday high of $0.67173. A return to $0.67 would signal a breakout session. However, economic indicators must support a breakout.
In case of a breakout session, the Aussie would likely test the Second Major Resistance Level (R2) at $0.6746. The Third Major Resistance Level (R3) sits at $0.6822.
Failure to move through the pivot would leave the First Major Support Level (S1) at $0.6623 in play. However, barring a risk-off-fueled sell-off, the AUD/USD pair should avoid sub-$0.66 and the Second Major Support Level (S2) at $0.6594.
The Third Major Support Level (S3) sits at $0.6518.
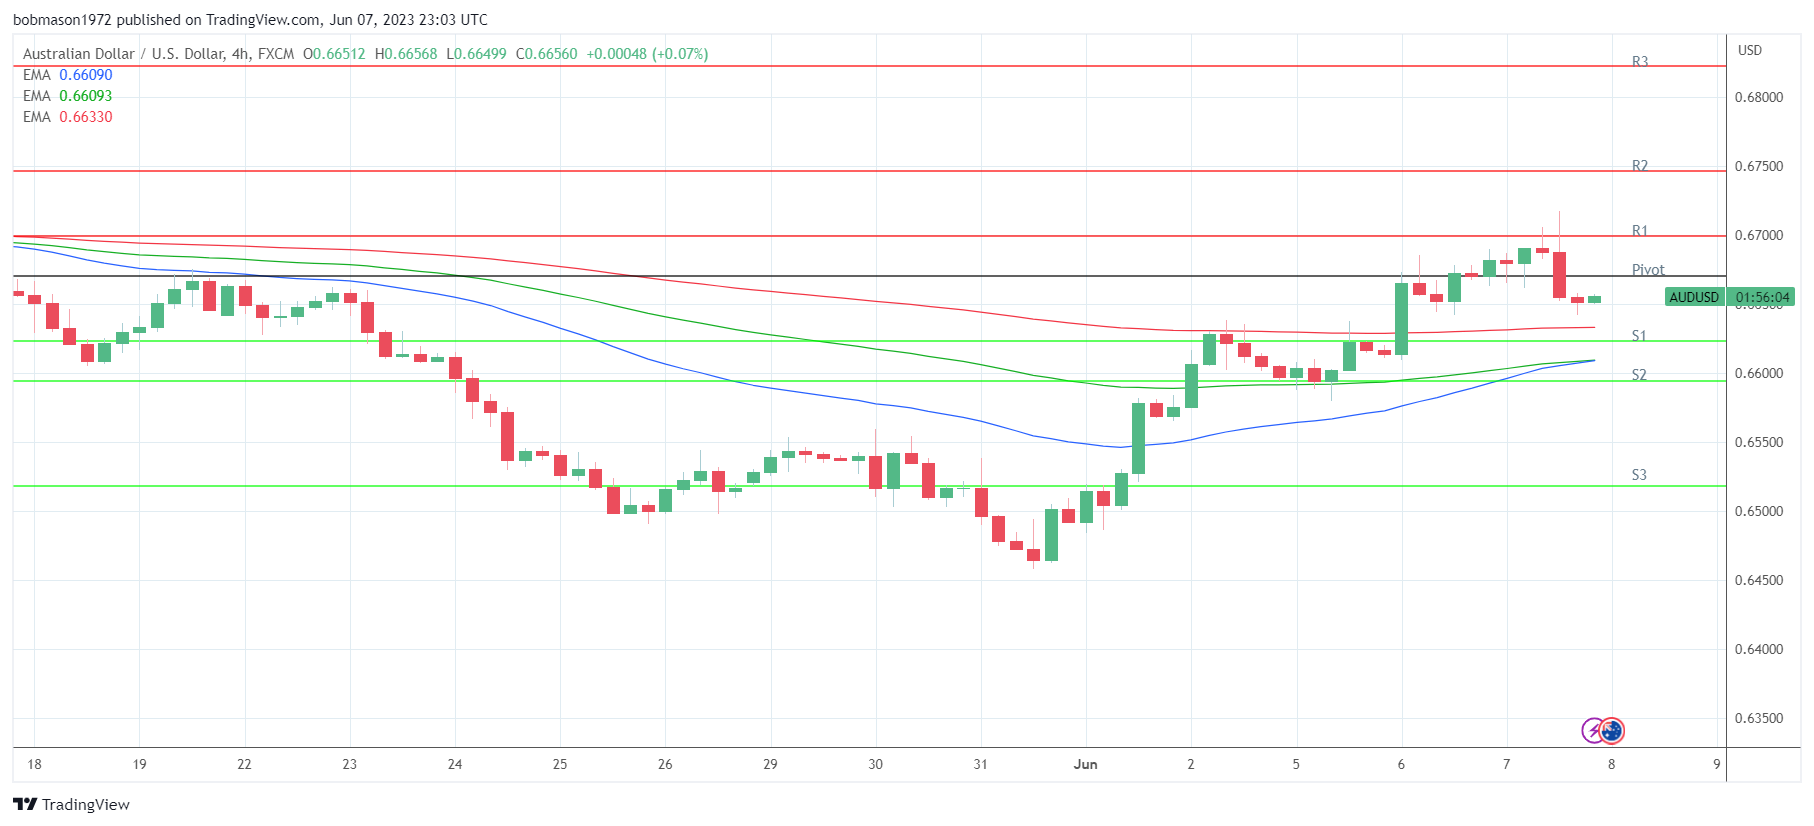
Looking at the EMAs and the 4-hourly chart, the EMAs sent bullish signals. The AUD/USD sat above the 200-day EMA, currently at $0.66330. The 50-day EMA converged on the 100-day EMA, with the 100-day EMA narrowing on the 200-day EMA, delivering bullish signals.
A bullish cross of the 50-day EMA through the 100-day EMA would support a breakout from R1 ($0.6699) to give the bulls a run at R2 ($0.6746). However, a fall through the 200-day EMA ($0.66330) would bring S1 ($0.6623) and the 100-day ($0.66093) and 50-day ($0.66090) EMAs into view. An AUD/USD fall through the 50-day EMA would send a bearish signal.
NZD/USD Price Action
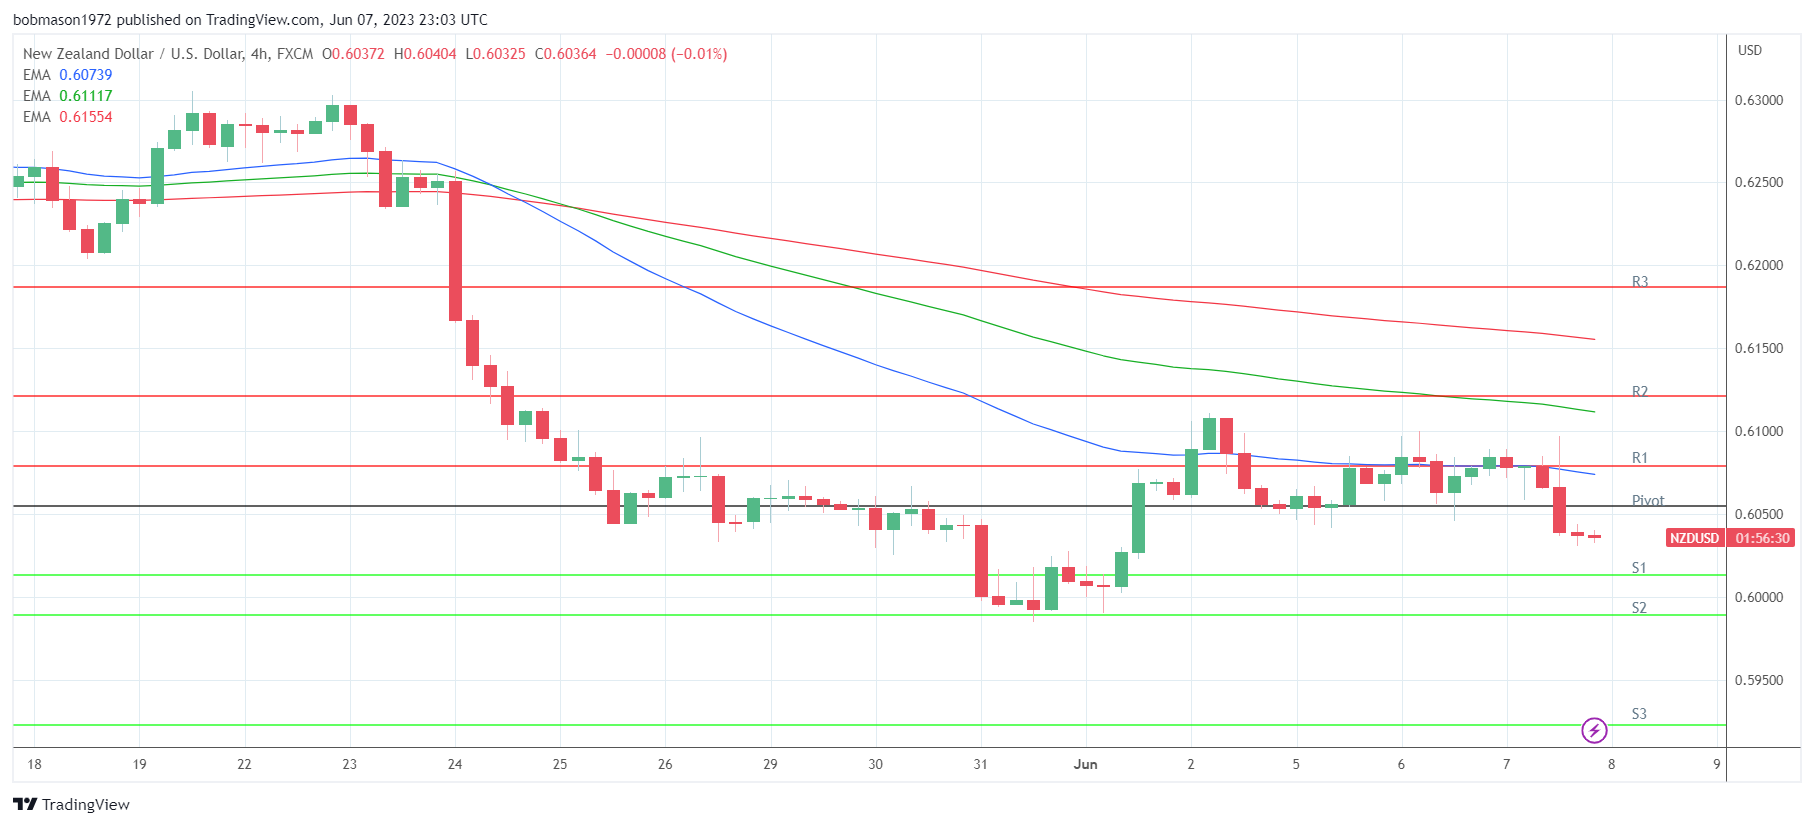
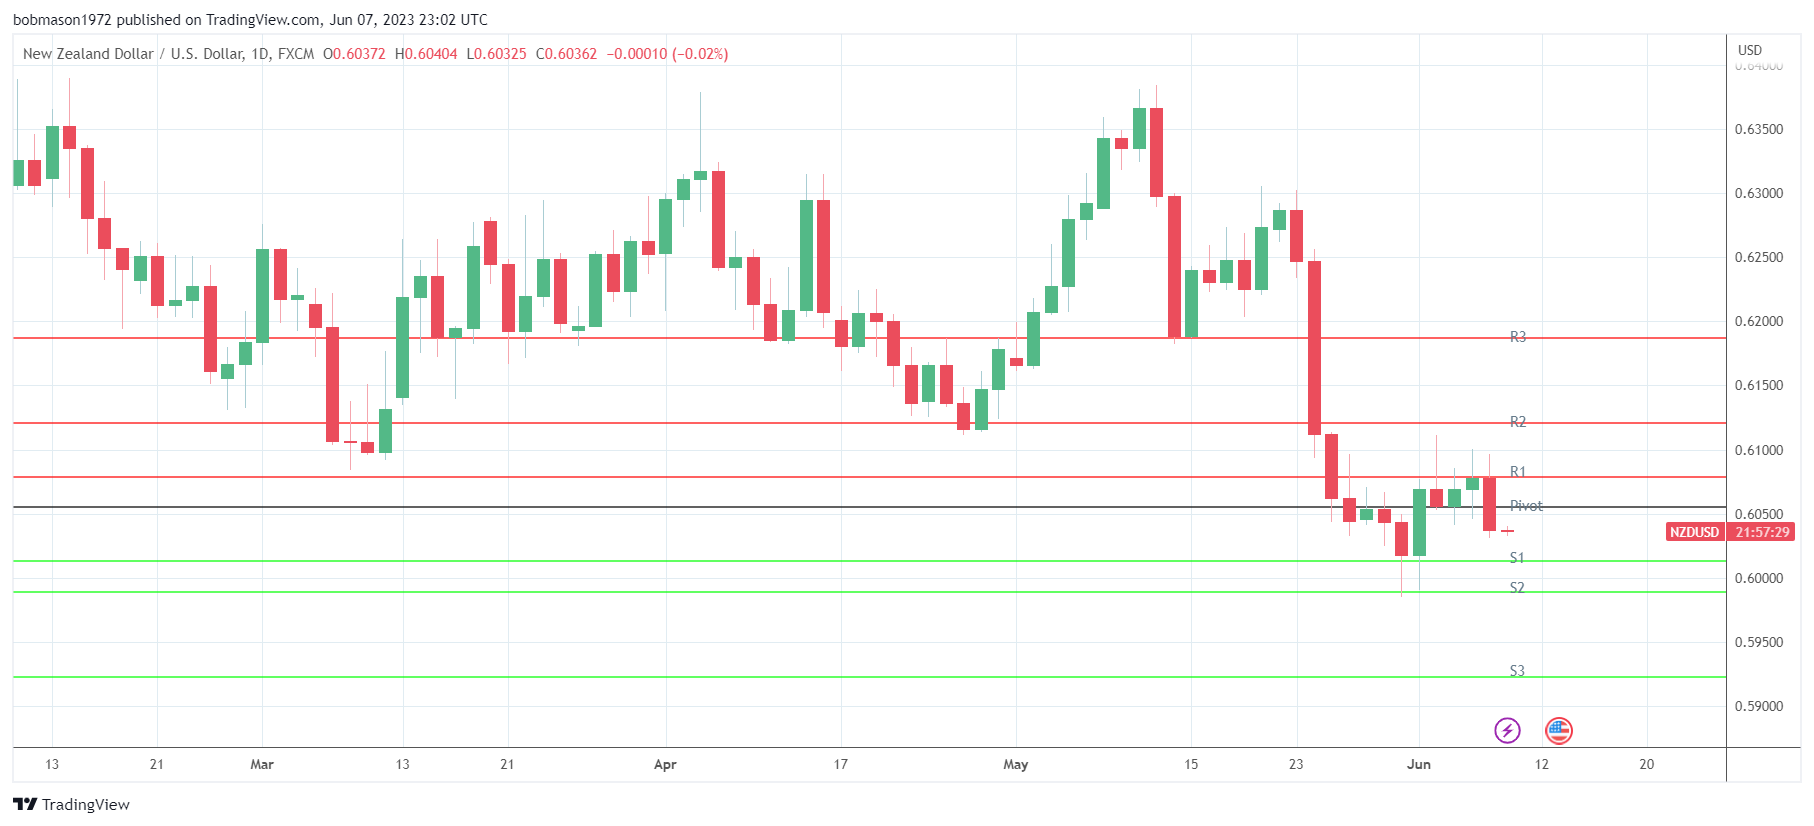
This morning, the NZD/USD was down 0.02% to $0.60362. A mixed start to the day saw the NZD/USD rise to an early high of $0.60404 before falling to a low of $0.60325.
Technical Indicators
Resistance & Support Levels
| R1 – $ | 0.6079 | S1 – $ | 0.6013 |
| R2 – $ | 0.6121 | S2 – $ | 0.5989 |
| R3 – $ | 0.6187 | S3 – $ | 0.5923 |
The NZD/USD has to move through the $0.6055 pivot to target the First Major Resistance Level (R1) at $0.6079 and the Wednesday high of $0.60969. A return to $0.6050 would signal a bullish session. However, the Kiwi would need risk-on sentiment to support a breakout.
In the case of a breakout session, the Kiwi would likely test resistance at $0.61 but fall short of the Second Major Resistance Level (R2) at $0.6121. The Third Major Resistance Level (R3) sits at $0.6187.
Failure to move through the pivot would leave the First Major Support Level (S1) at $0.6013 in play. However, barring a risk-off-fueled sell-off, the NZD/USD should steer clear of sub-$0.60 and the Second Major Support Level (S2) at $0.5989
The Third Major Support Level (S3) sits at $0.5923.
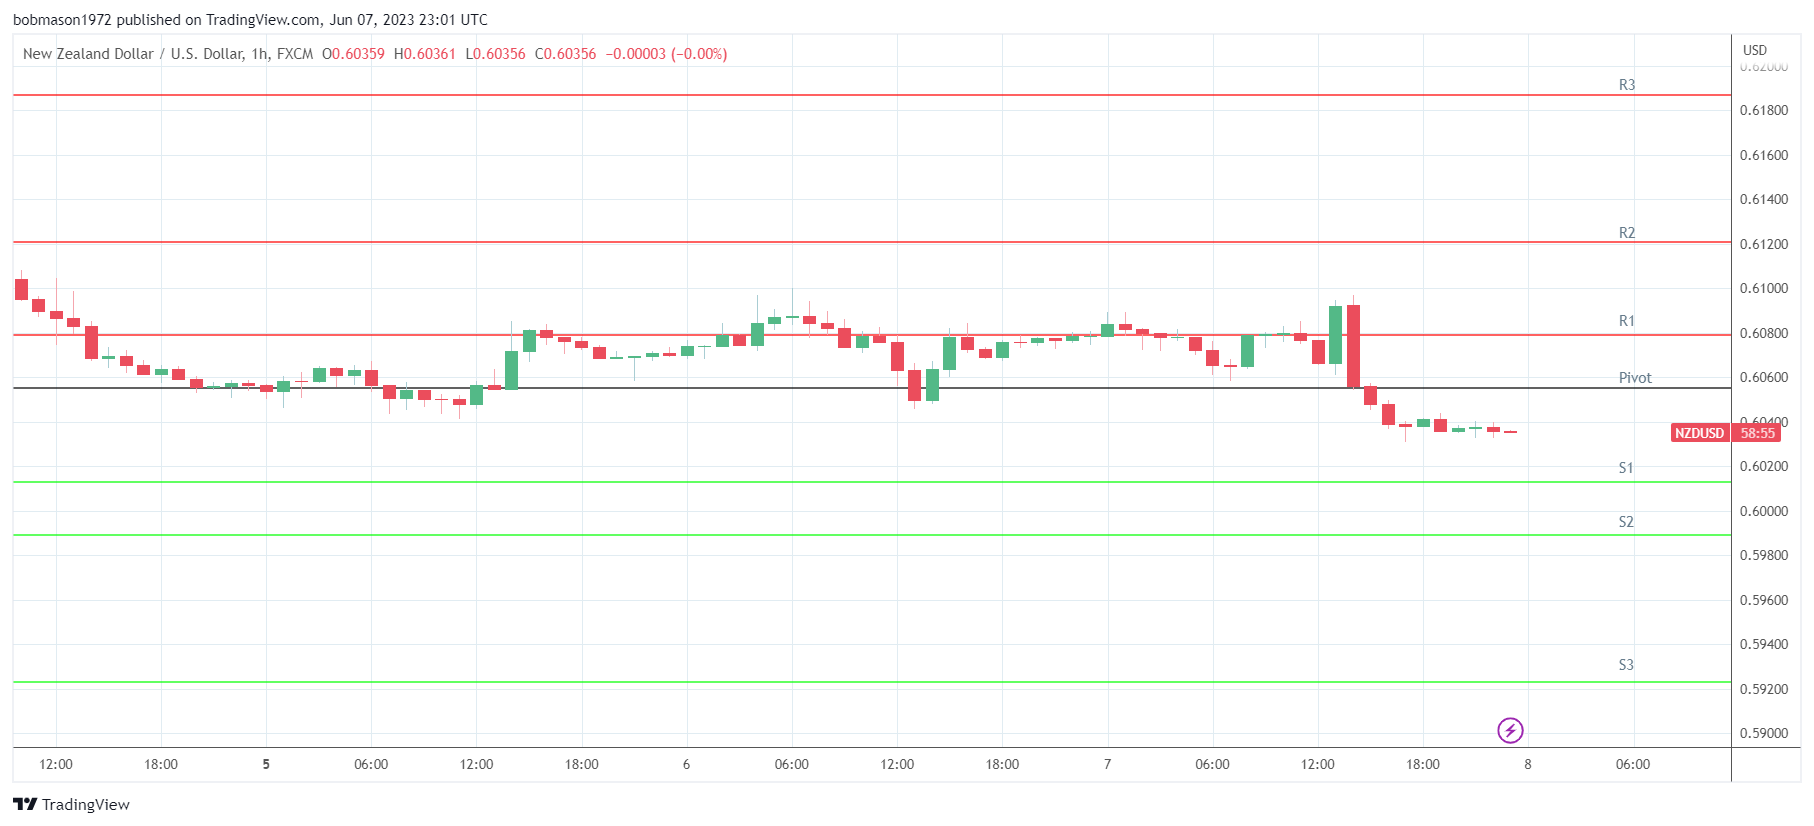
Looking at the EMAs and the 4-hourly chart, the EMAs were bearish. The NZD/USD sat below the 50-day EMA, currently at $0.60739. The 50-day EMA slid back from the 100-day EMA, with the 100-day EMA falling back from the 200-day EMA, delivering bearish signals.
An NZD/USD breakout from the 50-day EMA ($0.60739) and R1 ($0.6079) would give the bulls a run at $0.61 and the 100-day EMA ($0.61117). However, failure to move through the 50-day EMA ($0.60739) would leave S1 ($0.6013) in view. A breakout from the 50-day EMA would send a bullish signal.