
Advertisement
Advertisement
10-Yr U.S. Treasury Notes (TY) Futures Technical Analysis – August 18, 2015 Forecast
By:
September 10-Year U.S. Treasury Notes are trading slightly lower shortly before the cash market opening after an early session rally failed to attract
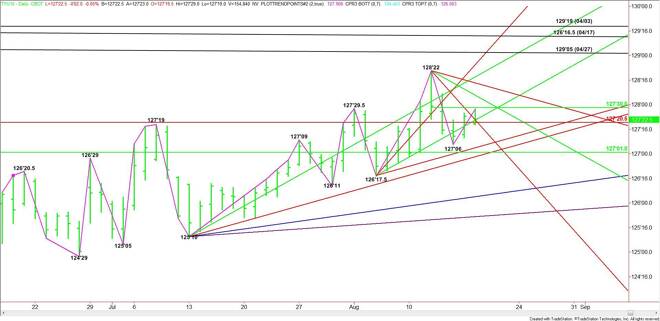
September 10-Year U.S. Treasury Notes are trading slightly lower shortly before the cash market opening after an early session rally failed to attract enough buying to hold on to the gains. The early rally to 127’29 made 127’06 a new main bottom. A trade through this level will turn the main trend to down on the daily swing chart.
The short-term range is 128’22 to 127’06. Its 50% level or pivot at 127’30 is controlling the short-term direction of the market.
During the pre-market session, sellers came in to defend the pivot at 127’30. This drove the market into a price cluster at 127’22, 127’21.5 and 127’20.5. Watch for a technical bounce on the first test of this level and an acceleration to the downside if this area fails as support.
The daily chart indicates there is plenty of room to the downside if 127’20.5 fails. This could trigger an acceleration to the downside with the next targets coming in at 127’06 and 127’03.5.
The next two major downside targets are a 50% level at 127’01 and a long-term uptrending angle at 126’30.
A sustained move over 127’30 will signal the presence of buyers. The first target is a downtrending angle at 128’06. The last major angle before the 128’22 top comes in at 128’14.
Based on the current price at 127’22.5, look for a bullish tone to develop on a sustained move over 127’30 and a bearish tone to develop on a sustained move under 127’20.5.
About the Author
James Hyerczykauthor
James Hyerczyk is a U.S. based seasoned technical analyst and educator with over 40 years of experience in market analysis and trading, specializing in chart patterns and price movement. He is the author of two books on technical analysis and has a background in both futures and stock markets.


Advertisement