
Advertisement
Advertisement
10-Yr U.S. Treasury Notes (TY) Futures Technical Analysis – August 31, 2015 Forecast
By:
December 10-Year U.S. Treasury Notes attempted to breakout to the upside on Friday, but the move failed into the close. The main trend is up according to
December 10-Year U.S. Treasury Notes attempted to breakout to the upside on Friday, but the move failed into the close. The main trend is up according to the daily swing chart, however, momentum has shifted to the downside since the People’s Bank of China initiated fresh stimulus measures early last week.
On Friday, Fed Vice Chair Stanley Fischer told CNBC that the Fed is still on track for a rate hike this year. Over the week-end, he reiterated his remarks stating that the Fed is aware of the recent volatility in the market, but that its main focus is the labor and inflation data. The puts a lot of emphasis on Friday’s U.S. Non-Farm Payrolls report. Fischer’s comments could trigger a volatile reaction today.
Volume may be below average this week with many of the major players on the sidelines ahead of the jobs data. However, this could lead to a volatile, two-sided trade as investors continue to position themselves ahead of Friday’s report. A stronger-than-expected jobs number will likely move up the timeline for a rate hike if you believe Fischer. This could cause tremendous volatility into the FOMC meeting later this month.
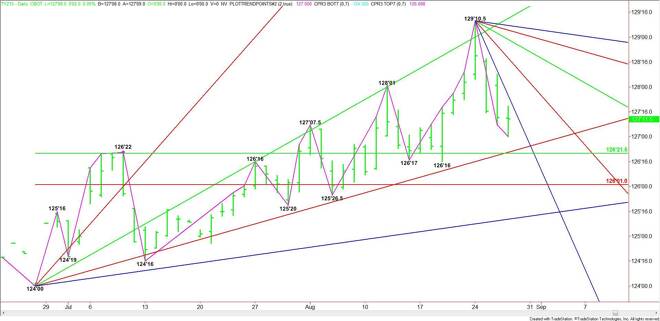
Technically, the main trend is up according to the daily swing chart. The main range is 124’00 to 129’10.5. The potential downside targets today are last week’s low at 127’00, a long-term uptrending angle at 126’26 and a major 50% level at 126’21.5.
A trade through 126’16 will turn the main trend to down. This could trigger a further break into the major Fibonacci level at 126’01.
The key downtrending angle to watch is at 126’26.5. This angle is controlling the short-term direction of the market. A sustained move under this angle will signal the presence of sellers. Overcoming this angle will indicate that buyers have returned.
A sustained move over 126’26.5 could trigger an eventual move into a downtrending angle at 128’02.5. This is followed by a short-term retracement zone at 128’05 to 128’14.
Watch the price action and read the order flow at 126’26.5 to 126’00. This will tell us whether the bulls or the bears are in control.
About the Author
James Hyerczykauthor
James Hyerczyk is a U.S. based seasoned technical analyst and educator with over 40 years of experience in market analysis and trading, specializing in chart patterns and price movement. He is the author of two books on technical analysis and has a background in both futures and stock markets.


Advertisement