
Advertisement
Advertisement
30-Yr U.S. Treasury Bonds (US) Futures Technical Analysis – August 10, 2015 Forecast
By:
September 30-Year U.S. Treasury Bonds finished sharply higher and on the bullish side of a Fibonacci level on Friday, putting the market in a position to
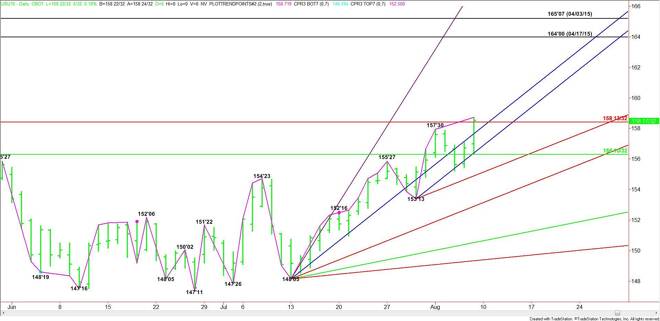
September 30-Year U.S. Treasury Bonds finished sharply higher and on the bullish side of a Fibonacci level on Friday, putting the market in a position to accelerate to the upside.
The key number to watch today is 158’13. A sustained move over this level could create enough upside momentum to trigger an acceleration to the upside. The daily chart indicates there is plenty of room to rally since the next potential targets are the April 17 top at 164’00 and the April 3 top at 165’07.
A break back under the Fib level at 158’13 will signal the presence of sellers. This could lead to a break into the steep uptrending angle at 158’05. This angle has guided the market higher since the 148’05 main bottom on July 13.
If the selling is strong enough to take out 158’05 then look for another sharp break into the next uptrending angle at 156’29. This angle is moving up .50 per day from the 153’13 main bottom and was successfully tested three times last week.
The next target under 156’29 is the major 50% level at 156’10. This price is a potential trigger point for a sharp break into 155’05.
Watch the price action and read the order flow at 158’13 today. This should tell us whether the bulls or the bears are in control.
About the Author
James Hyerczykauthor
James Hyerczyk is a U.S. based seasoned technical analyst and educator with over 40 years of experience in market analysis and trading, specializing in chart patterns and price movement. He is the author of two books on technical analysis and has a background in both futures and stock markets.


Advertisement