
Advertisement
Advertisement
30-Yr U.S. Treasury Bonds (US) Futures Technical Analysis – August 14, 2015 Forecast
By:
September 30-Year U.S. Treasury Bonds are trading a little better after Thursday’s sell-off. Yesterday, the market reacted to the previous day’s
September 30-Year U.S. Treasury Bonds are trading a little better after Thursday’s sell-off. Yesterday, the market reacted to the previous day’s potentially bearish closing price reversal top. Although the chart pattern was confirmed, there was very little follow-through to the downside. The overnight price action suggests the market may be setting up for a near-term retracement.
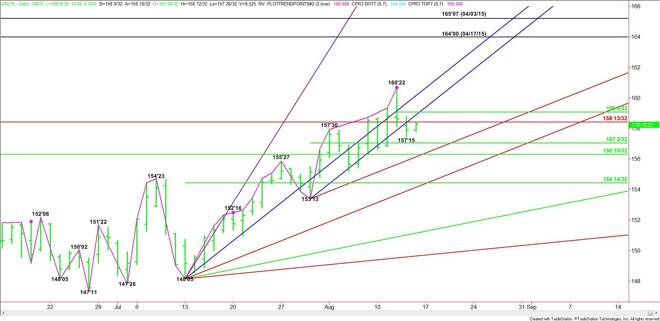
The main trend is up according to the daily swing chart, but the current price action suggests momentum may be shifting to the downside. The short-term range is 160’22 to 157’15. Its 50% or pivot price is 159’03. Trader reaction to this pivot will tell us whether the selling pressure is strong enough to form a secondary lower top, or if buyers are ready to take this market to a new high.
In addition to overcoming the pivot at 159’03, other signs of buyers will be overcoming and sustaining rallies over steep uptrending angles at 158’29 and 160’05. Of course, taking out the closing price reversal top at 160’22 will signal a resumption of the uptrend.
Based on the early price action, the first resistance is a major Fibonacci level at 158’13. A failure to overcome this level will signal the presence of sellers. This could trigger a sell-off into a minor 50% level at 157’02 and a potential support cluster at 156’10 to 156’05.
The daily chart opens up to the downside under 156’05 with the next major target coming in at 154’14 to 154’05.
The first key level to overcome today is 158’13, however, the main level controlling the direction of the market is the short-term pivot at 159’03. Trader reaction to this level will tell us whether the bulls or the bears are in control.
About the Author
James Hyerczykauthor
James Hyerczyk is a U.S. based seasoned technical analyst and educator with over 40 years of experience in market analysis and trading, specializing in chart patterns and price movement. He is the author of two books on technical analysis and has a background in both futures and stock markets.


Advertisement