



Key Insights:
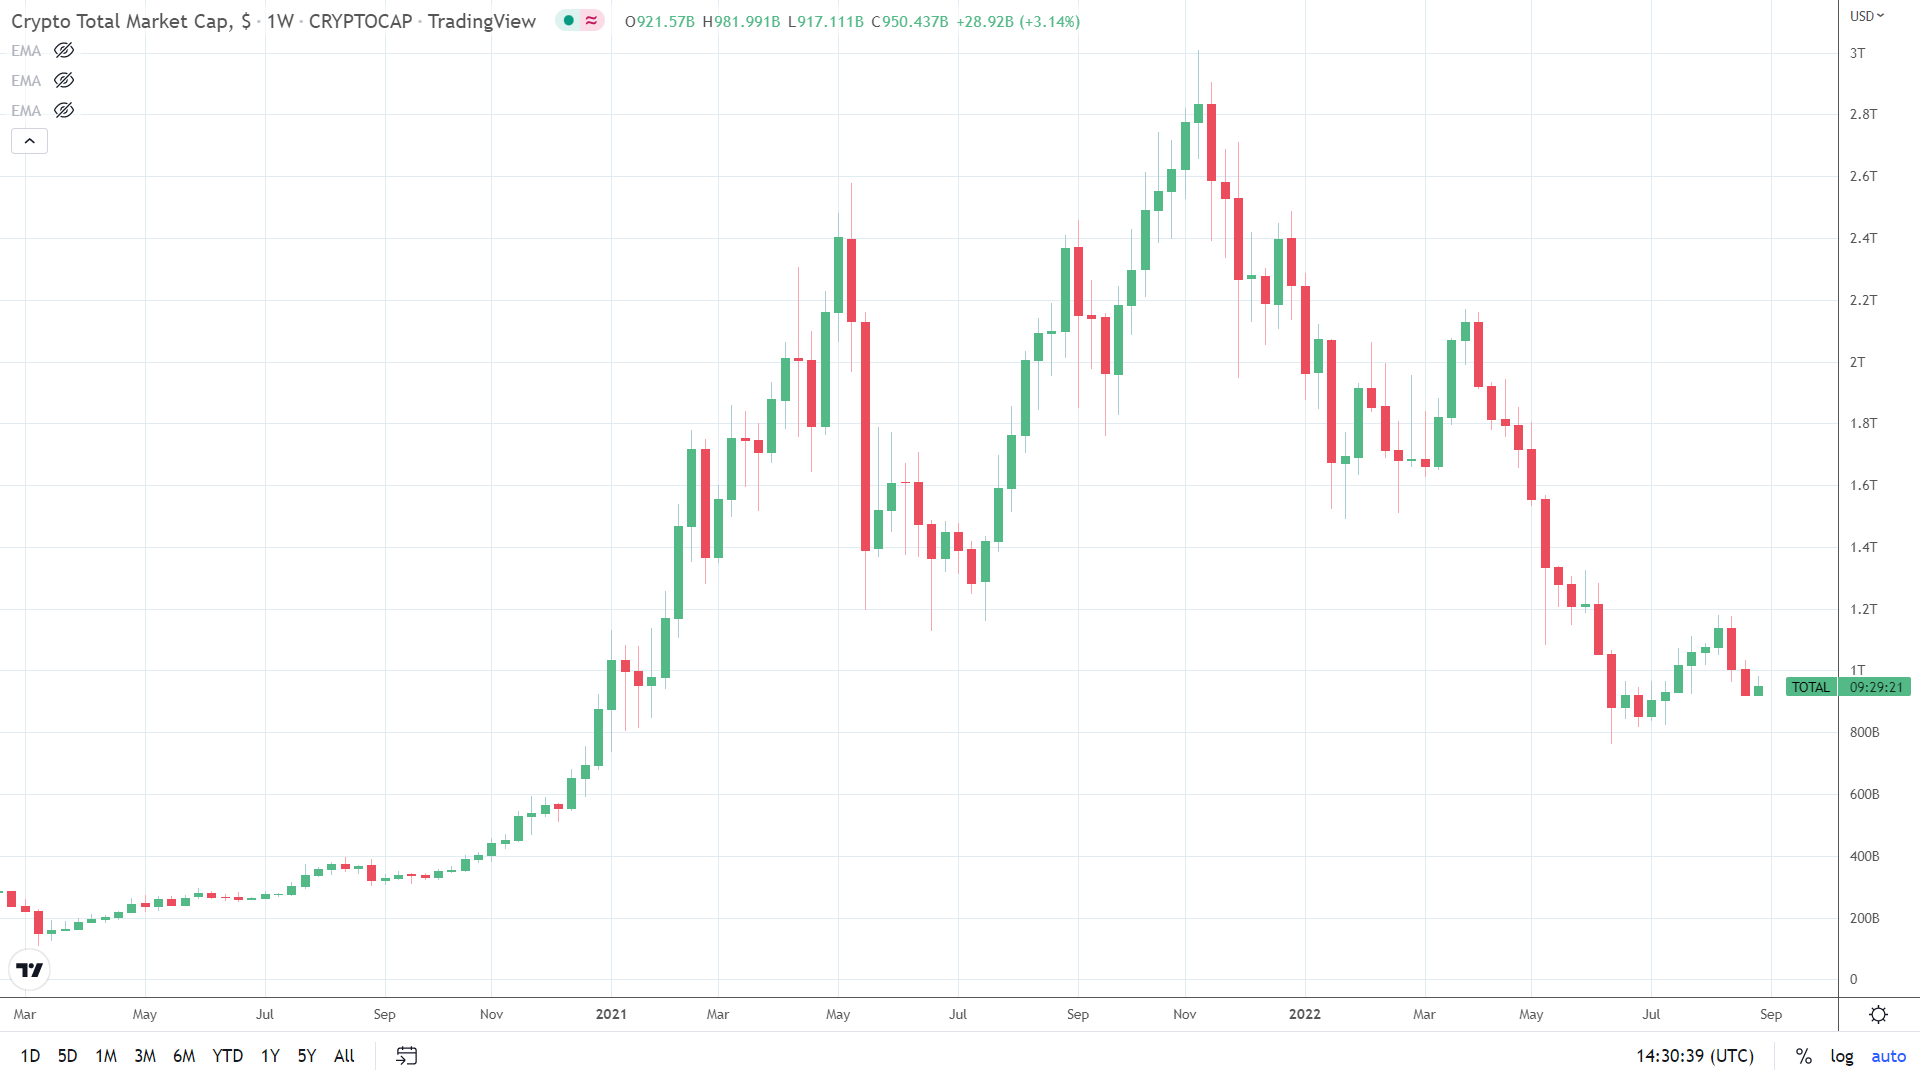
- It is a bullish week, with the total crypto market cap up by $28.9 billion to $950.4 billion.
- Cardano (ADA) and Ethereum (ETH) lead the way, with the Vasil hard fork news and sentiment towards the Merge delivering breakout weeks.
- However, technical indicators remain mixed, with market sentiment towards the Fed a headwind.
In the current week, the total crypto market cap is up $28.9 billion (3.14%) to $950.4 billion. US economic indicators and market sentiment towards Fed monetary policy provided direction in the week. While Fed fear remained a headwind, crypto network news delivered support.
Cardano ADA
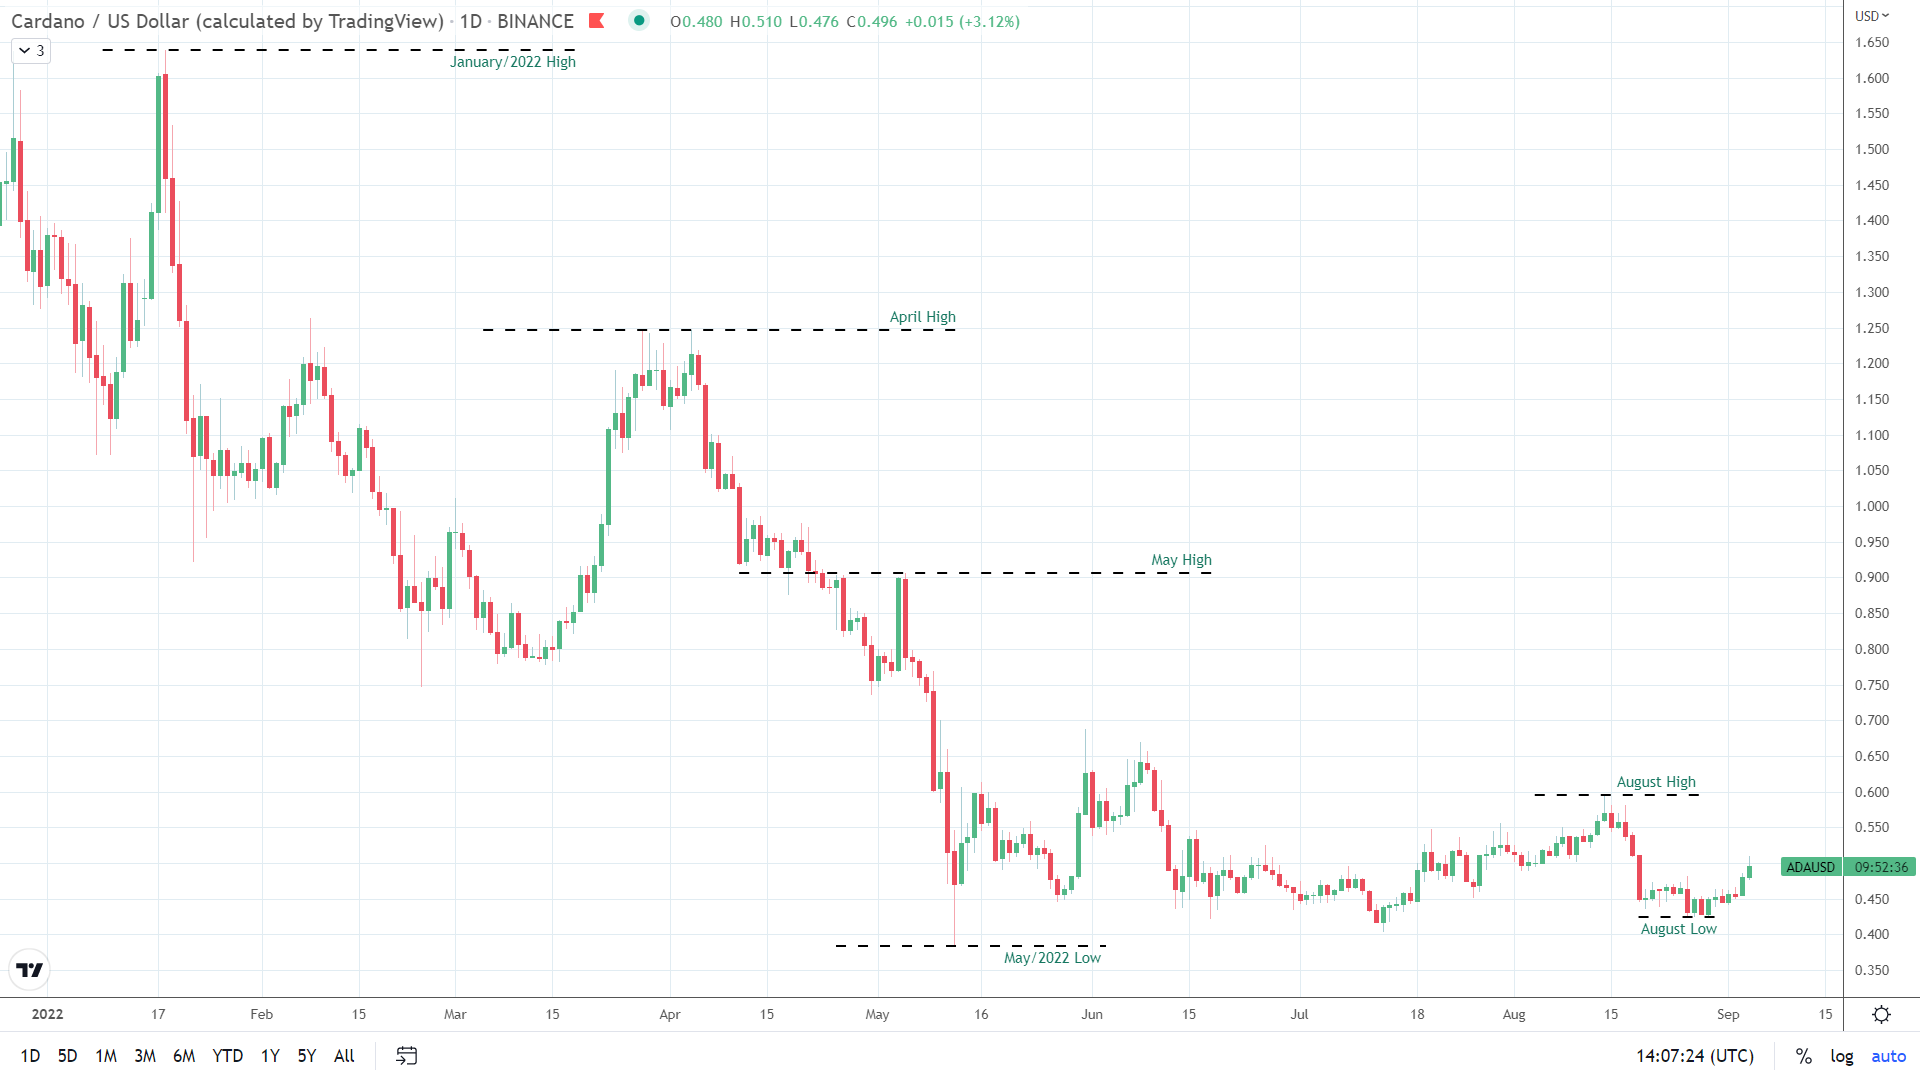
For the current week, Monday through Sunday, ADA was up 15.6% to $0.496. Bullish from the start of the week, ADA rallied from a Monday low of $0.424 to a Sunday high of $0.510 before easing back.
Despite the bullish week, ADA came up short of the August high of $0.595. Throughout the week, Vasil hard fork updates delivered ADA price support.
Early in the week, news of 75% of SPO nodes upgrading to v1.35.3 provided price support. However, Friday’s announcement of a September 22 Vasil hard fork date delivered a breakout weekend and a return to $0.51.
On a trend analysis basis, ADA would need to move through the August high of $0.595 to break through the June high of $0.6688 and target the May high of $0.906. A return to $0.55 in the early part of the week will be the key. However, a fall through this week’s August low of $0.425 would bring the May and the current year low of $0.384 into view.
Vasil hard fork chatter should continue to provide direction.
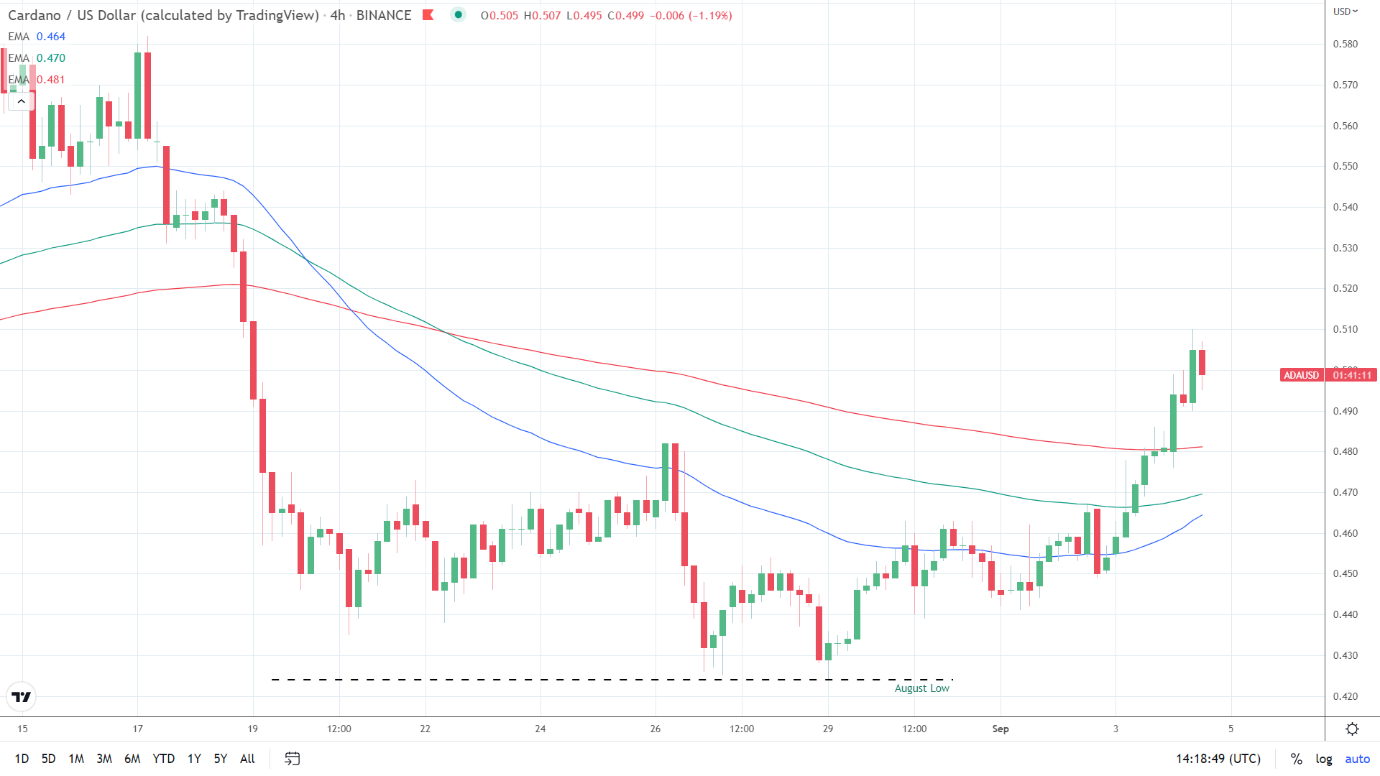
Looking at the EMAs, based on the 4-hourly, it was a bullish signal. ADA sat above the 200-day EMA, currently at $0.481. The 100-day EMA narrowed to the 200-day EMA, with the 50-day EMA closing in on the 100-day EMA to deliver positive price signals.
A bullish cross of the 50-day EMA through the 100-day EMA would support a run at the August high. However, a fall through the 200-day EMA ($0.481) would likely test support at the 100-day EMA ($0.470). Barring a crypto-meltdown, ADA should steer clear of the August low of $0.425.
Polkadot (DOT)
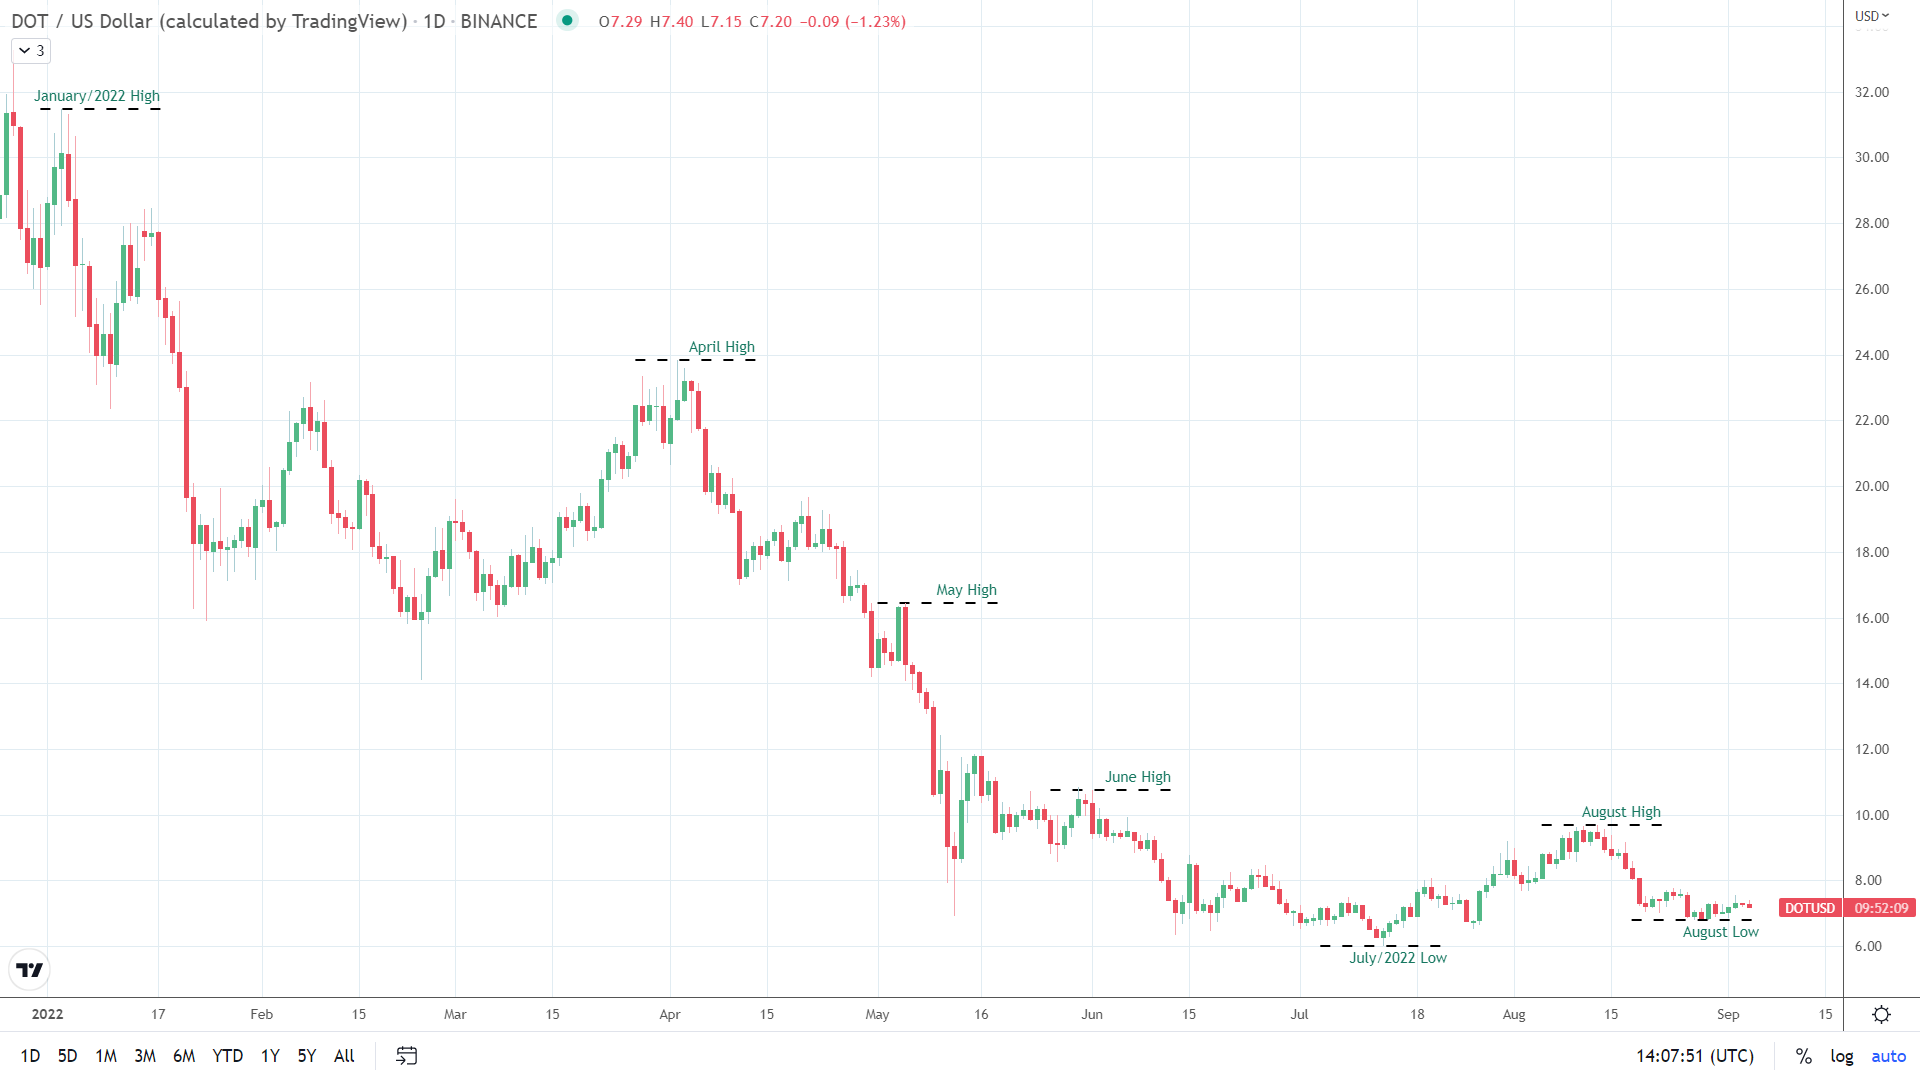
Monday through Sunday, DOT is up 4.80% to $7.20. A mixed start to the week saw DOT fall to a Monday and an August low of $6.79 before rallying to a Friday high of $7.57. However, a bearish weekend left DOT back at sub-$7.30.
There were no network updates to provide DOT support, with DOT briefly re-entering the top ten cryptos by market cap before falling back out.
Looking at the trends, a DOT move through the August high of $9.68 would support a run at $10.00 and the June high of $10.73. From $10.73, DOT would have a clear run at the May high of $16.44.
However, DOT has to avoid the August low of $6.79 to prevent a continued retrace to the current year’s low of $5.99. While network updates will influence, Fed Fear keeps US economic indicators in the spotlight.
Looking at the EMAs, based on the 4-hourly, the signal was bearish. DOT sat below the 50-day EMA, currently at $7.24. The 100-day EMA fell back from the 200-day EMA, while the 50-day EMA narrowed to the 200-day EMA. The indicators delivered mixed price signals.
A DOT slide from the 50-day EMA would likely see DOT slide through the August low of $6.79 to bring the current year low of $5.99 into view. However, a DOT move through the 100-day EMA ($7.43) to $7.50 would give the bulls a run at the 200-day EMA ($7.67). A return to $8.00 would bring the August high of $9.68 into play.

Ethereum (ETH)
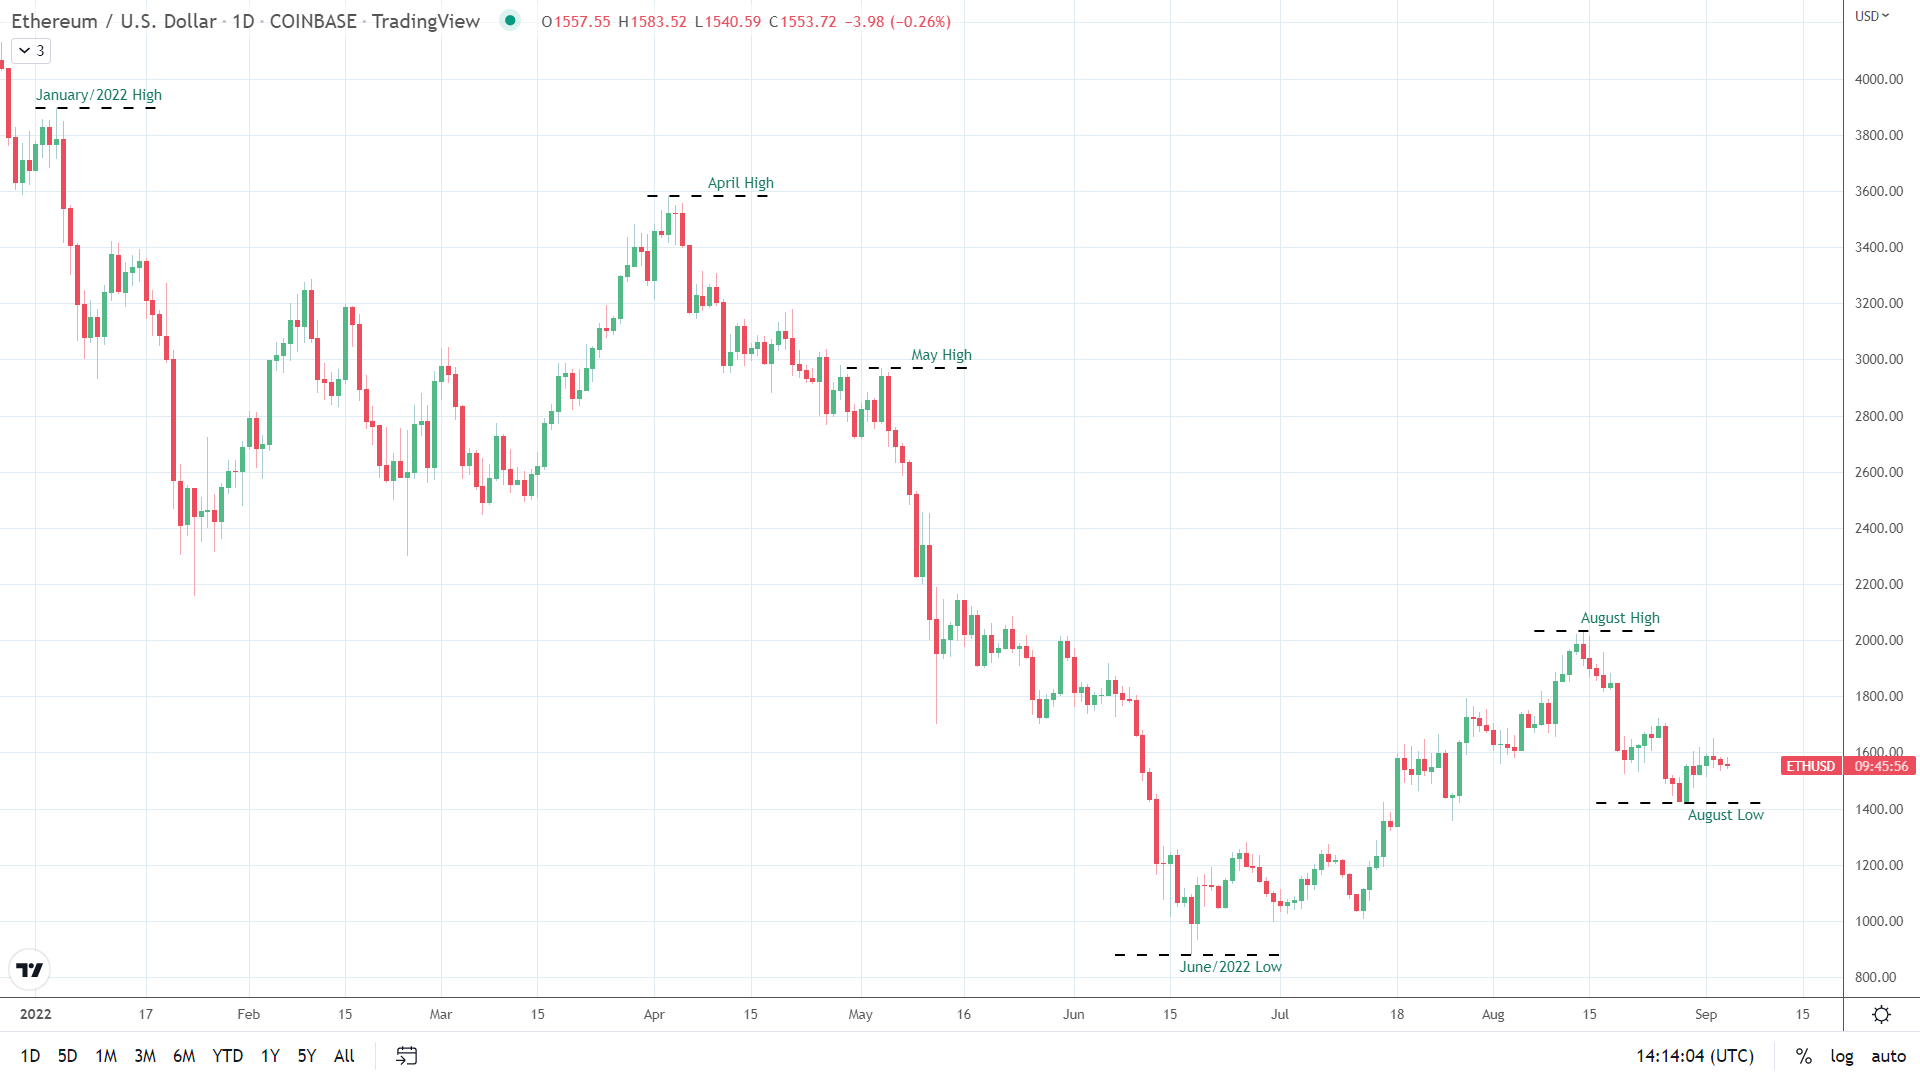
Monday through Sunday, ETH was up 8.98% to $1,554. A mixed start to the week saw ETH fall to a Monday and an August low of $1,421 before rallying to a Friday high of $1,650.
Investor sentiment towards the upcoming Merge continued to provide ETH price support.
Looking at the trends, an ETH return to $1,700 would support a breakout from the August high of $2,013 and a move through to $2,500. From $2,500, the bulls would target the May high of $2,968 and $3,000. A return to $3,000 would give the bulls a run at the April high of $3,582.
A fall through the August low of $1,421 would bring the June and the current year’s low of $880 into view.
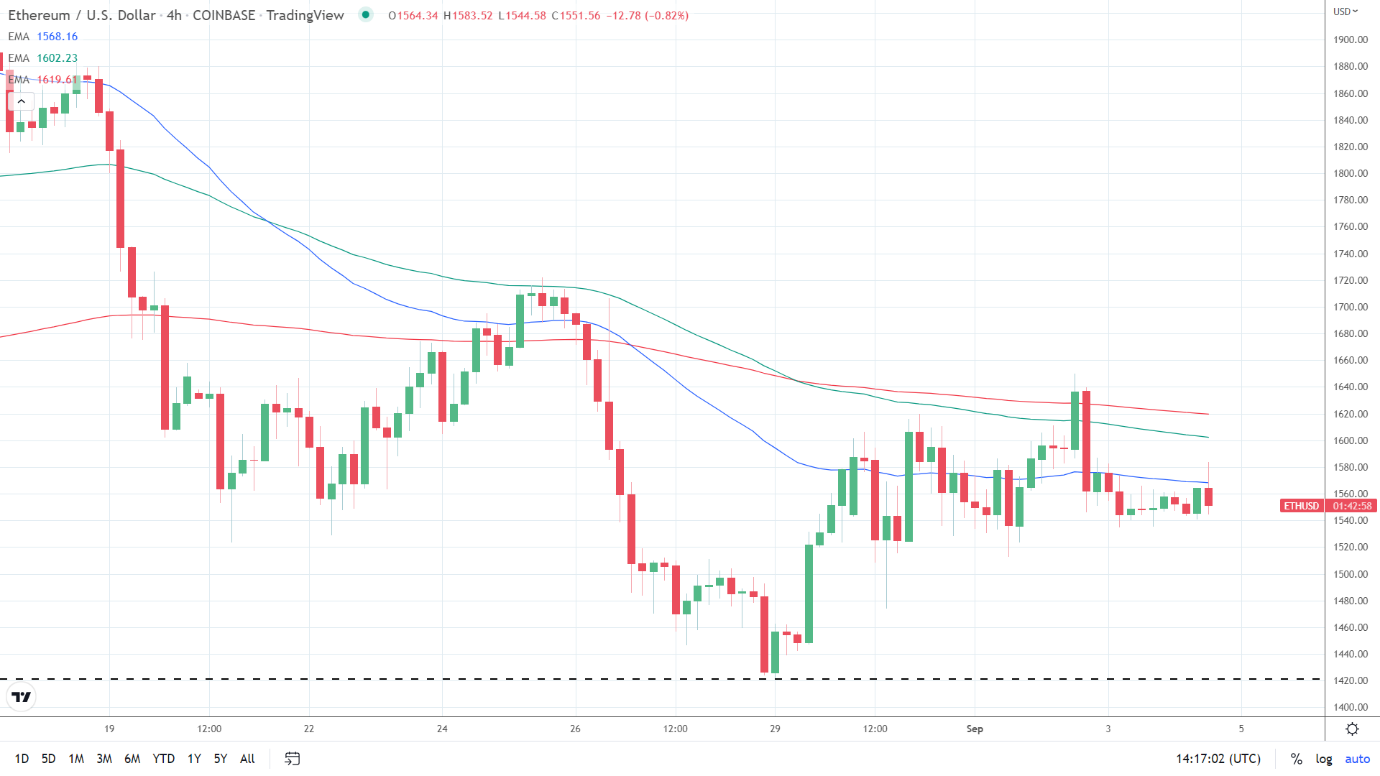
Looking at the EMAs, based on the 4-hourly, it was a bearish signal. ETH sat below the 50-day EMA, currently at $1,568. The 50-day EMA fell back from the 200-day EMA, with the 100-day EMA easing back from the 200-day EMA, both ETH price negatives.
An ETH move through the 50-day EMA ($1,568) would support a run at the 100-day EMA ($1,602) and the 200-day EMA ($1,620). A breakout from the 200-day EMA would give the bulls a run at the August high of $2,031.
However, a fallback from the 50-day EMA would bring the August low of $1,421 into view.
Solana (SOL)
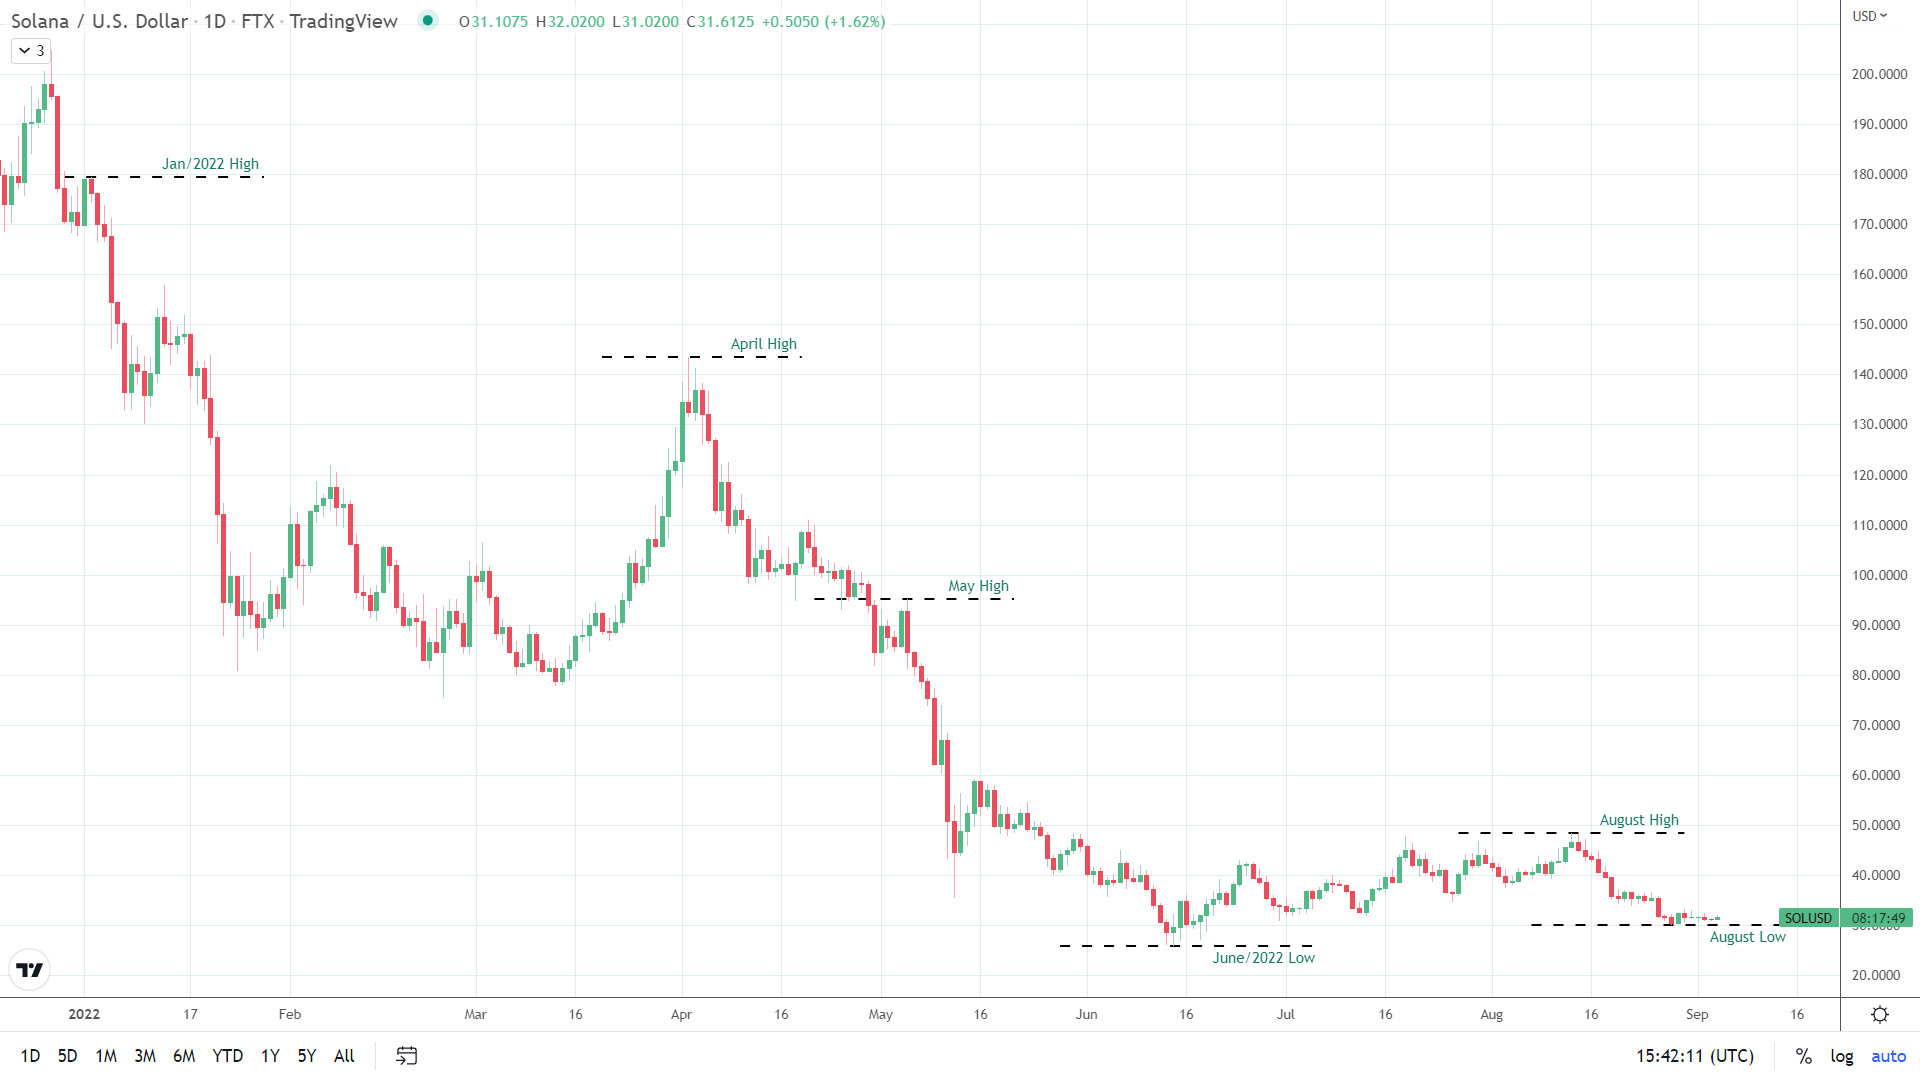
Monday through Sunday, SOL was up 3.95% to $31.6125. Tracking the broader market, SOL fell to a Monday and an August low of $29.9150 before rallying to a Tuesday high of $33.1725.
US economic indicators and market sentiment towards the Fed provided direction throughout the week.
Looking at the trends, a move through the August high of $48.42 would give the bulls a run at the May high of $95.19. SOL would need plenty of support to break out from $75.
However, a fall through the August low of $29.9150 would give the bears a run at the June and the current year low of $25.78.
Looking at the EMAs, based on the 4-hourly, it was a bearish signal. SOL sat below the 50-day EMA, currently at $32.0634
The 50-day EMA fell back from the 200-day EMA, with the 100-day EMA pulling back from the 200-day EMA, both price negatives.
An SOL slide from the 50-day EMA would bring sub-$30 and the August low of $29.9150 into play. From sub-$30, the bears will target the June 14 and current year low of $25.78.
However, an SOL breakout from the 50-day EMA ($32.0634) would support a run at the 100-day EMA (33.8112). An SOL move through the 100-day EMA gives the bulls a run at the 200-day EMA ($36.0668) and $40.
