The AUD/USD pair went back and forth during the day on Friday but found enough support at the 50-day exponential moving average to find a bit of buying
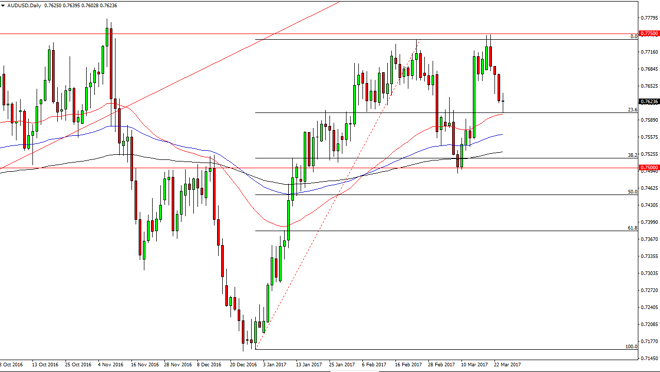
The AUD/USD pair went back and forth during the day on Friday but found enough support at the 50-day exponential moving average to find a bit of buying pressure. I think if we can break above the top of the candle for the day, the market will make another attempt towards the 0.7750 level above. If we break down below the bottom of the candle, we then must deal with the blue 100-day exponential moving average below for support, and then of course the 200-day exponential moving average on the chart, pictured in black.
Chris is a proprietary trader with more than 20 years of experience across various markets, including currencies, indices and commodities. As a senior analyst at FXEmpire since the website’s early days, he offers readers advanced market perspectives to navigate today’s financial landscape with confidence.