
Advertisement
Advertisement
AUD/USD Forex Technical Analysis – August 13, 2015 Forecast
By:
The People’s Bank of China intervened for a third session early Thursday, but the AUD/USD rebounded, suggesting the foreign currency and commodity markets
The People’s Bank of China intervened for a third session early Thursday, but the AUD/USD rebounded, suggesting the foreign currency and commodity markets may be stabilizing. China’s three currency devaluations this week shaved four percent off the Yuan since Monday. Today’s reaction was less dramatic, raising hopes that the market has absorbed the moves.
The reaction by traders to the latest devaluation suggests that currency volatility could be calming and that perhaps the Yuan had reached a comfort zone for the People’s Bank of China. With the markets calming, the focus for traders now shifts to Thursday’s U.S. retail sales report and the weekly employment claims.
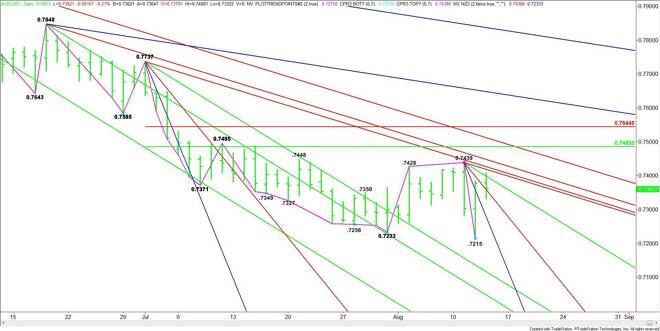
After reaching a new low for the year, the AUD/USD formed a potentially bullish closing price reversal bottom on Wednesday. The chart pattern was confirmed early Thursday when the Forex pair traded through .7386. Despite the downtrend, this price action suggests that momentum has shifted to the upside.
Based on the current price at .7356, the next upside target is a downtrending angle at .7399. This angle essentially stopped the rally earlier when the market traded up to .7408 before falling back. Additional downtrending angles come in at .7419, .7427 and .7448.
The main range is .7737 to .7215. Its retracement zone at .7485 to .7544 is today’s primary upside target. A downtrending angle also passes through this zone at .7512, making it a valid upside target also.
If the intraday selling persists then look for a pullback into a downtrending angle at .7359. This is followed by a short-term pivot at .7312 and another downtrending angle at .7279. This is the last potential support before the .7215 main bottom.
Beside the cluster of resistance angles, traders still have to deal with the main top at .7439. A trade through this top will turn the main trend to up on the daily swing chart, however, don’t expect too much of a follow-through rally because of the 50% level at .7485 and the Fibonacci level at .7544.
Looking at the current price action, it looks as if the direction of the market the rest of the session will be determined by trader reaction to .7378.
About the Author
James Hyerczykauthor
James Hyerczyk is a U.S. based seasoned technical analyst and educator with over 40 years of experience in market analysis and trading, specializing in chart patterns and price movement. He is the author of two books on technical analysis and has a background in both futures and stock markets.


Advertisement