

Gold’s Underperformance Signals Potential Upside for BTC/USD
The Bitcoin-to-Gold ratio (BTC/XAU) has rebounded 42.90% three months after hitting a local low of 24.84, trading around 36.51 as of July 14. That is about 13% lower than the pair’s record high established in December 2024.
Historical data shows a strong directional correlation between the BTC/XAU and BTC/USD pairs, particularly during risk-on cycles. In simple terms, Bitcoin tends to absorb more capital than gold during bull runs, reflecting traders’ growing preference for higher-beta assets.
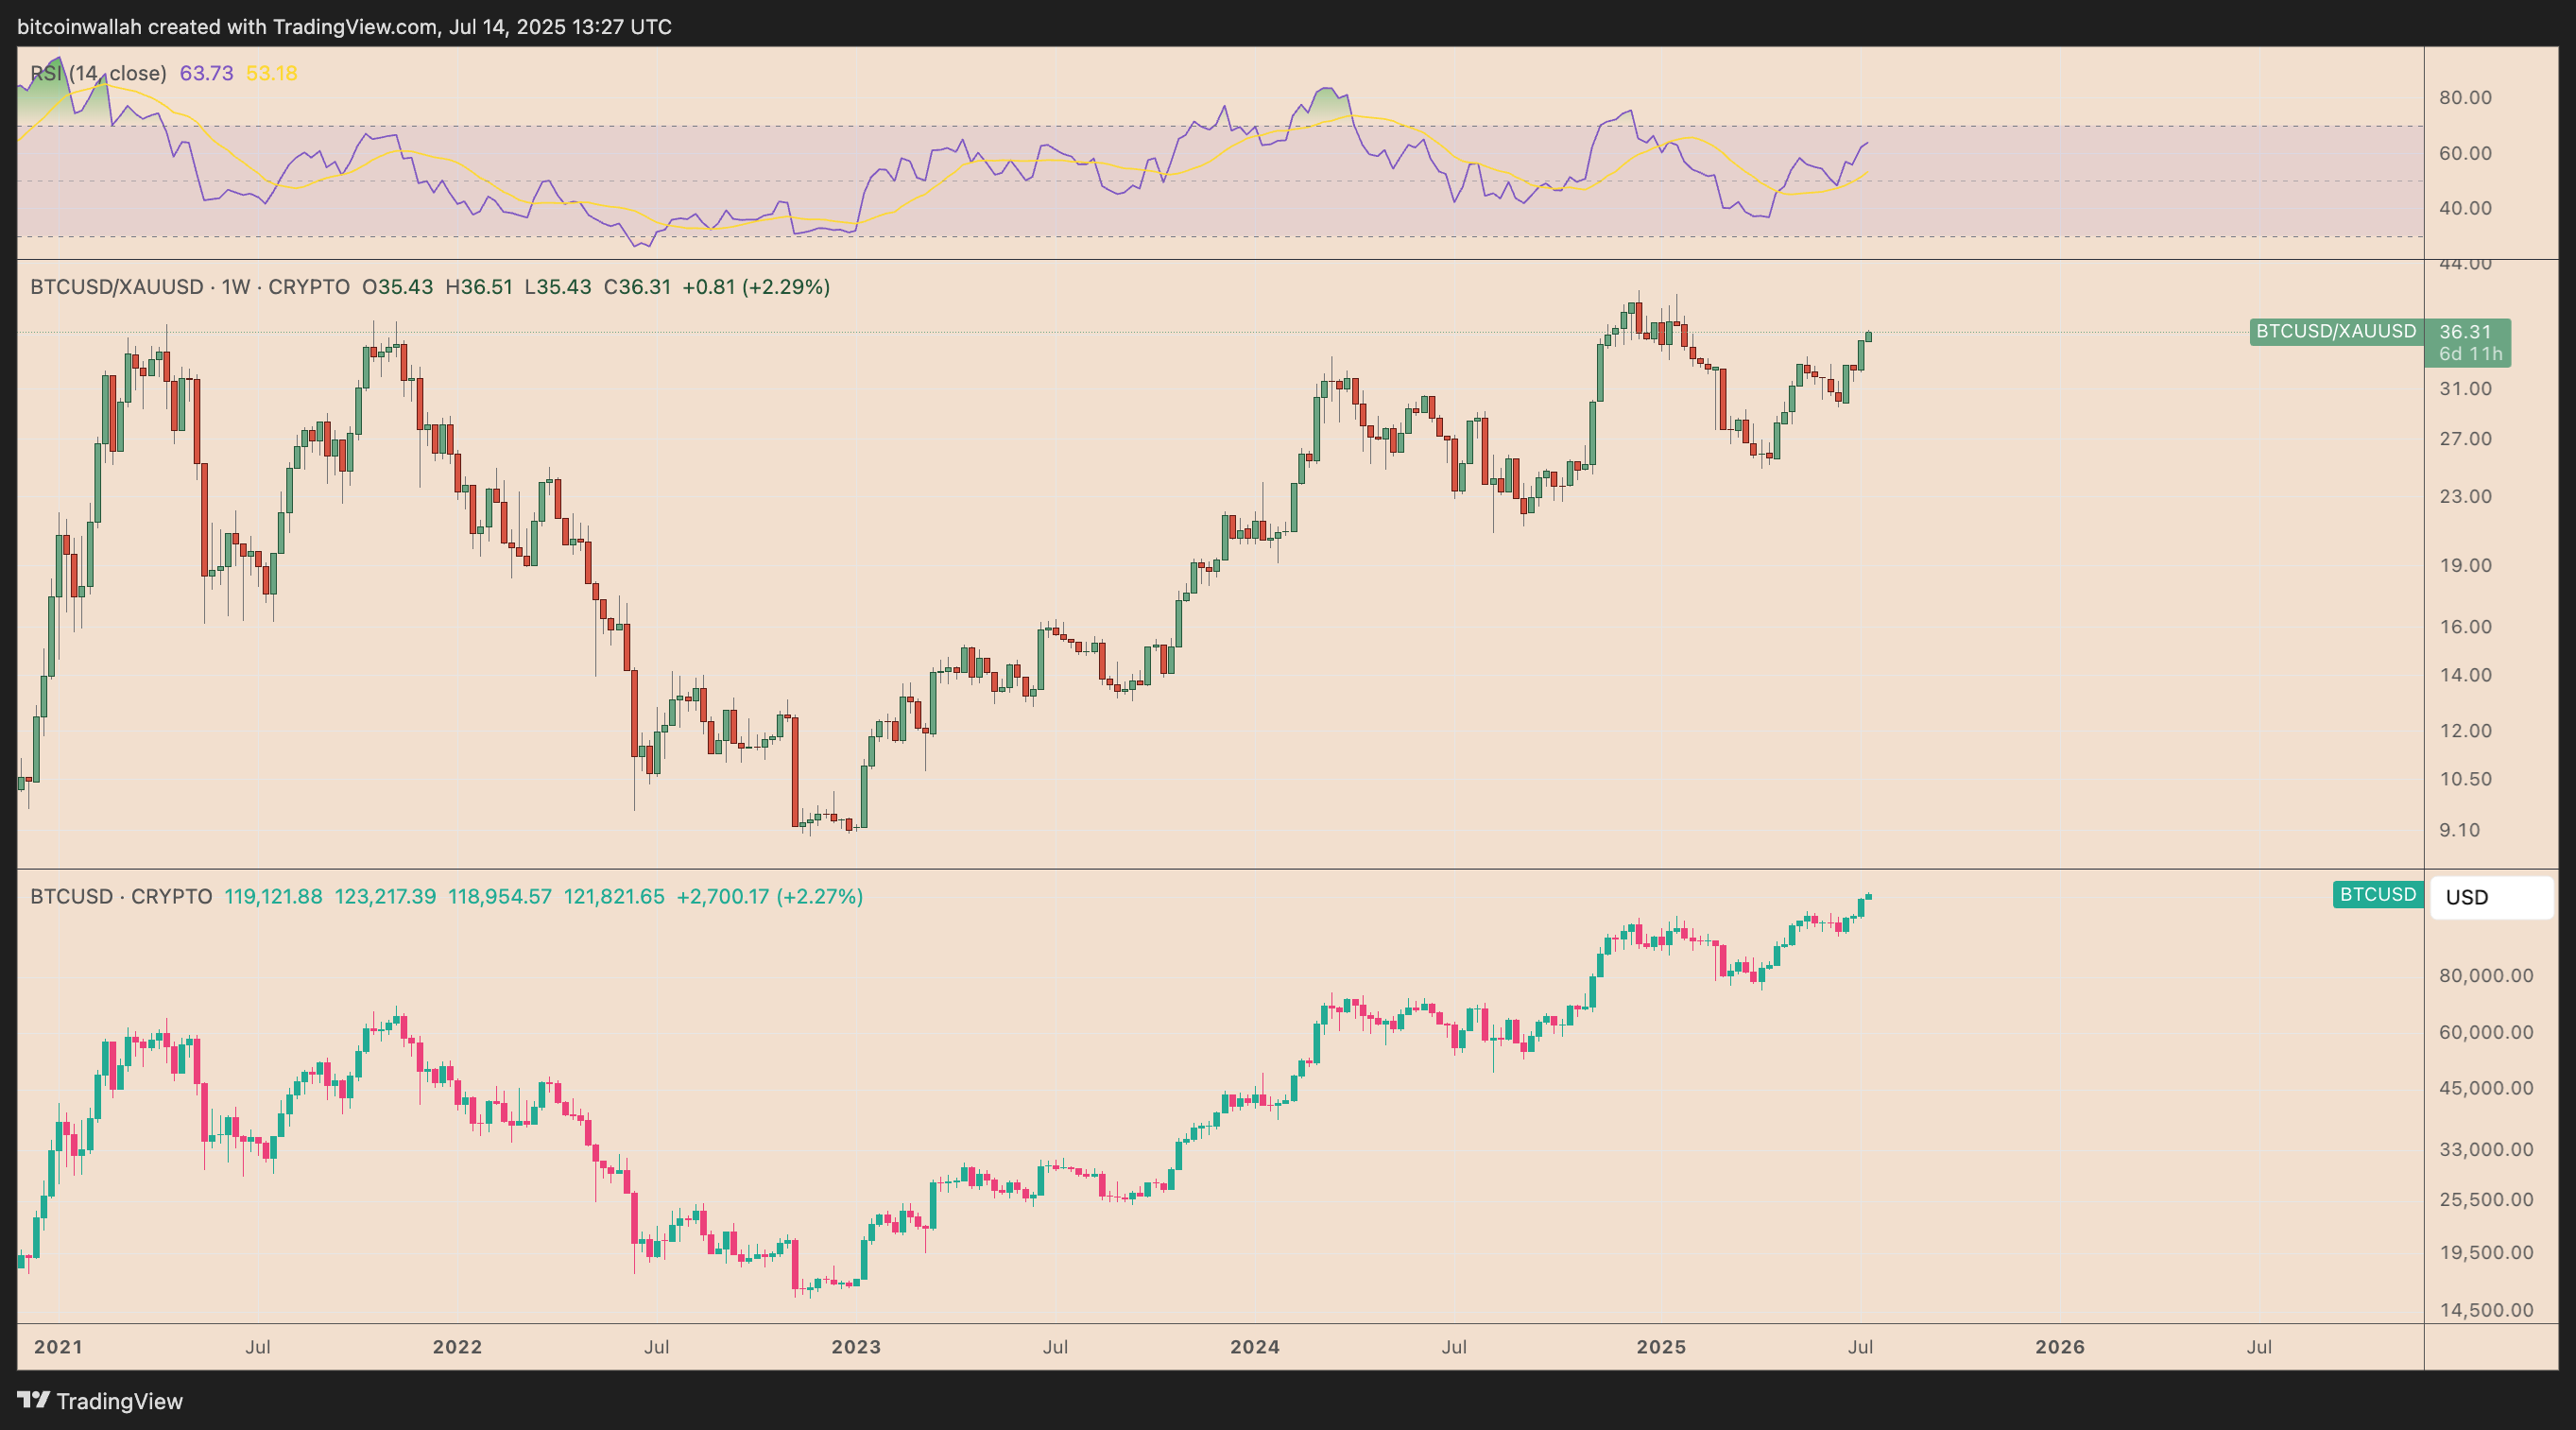
That trend appears to be repeating in 2025, backed by hard inflows and improving risk metrics.
Spot Bitcoin ETFs have captured 70% of gold’s year-to-date net inflows, marking a sharp rebound from a sluggish Q1, according to Ecoinometrics.
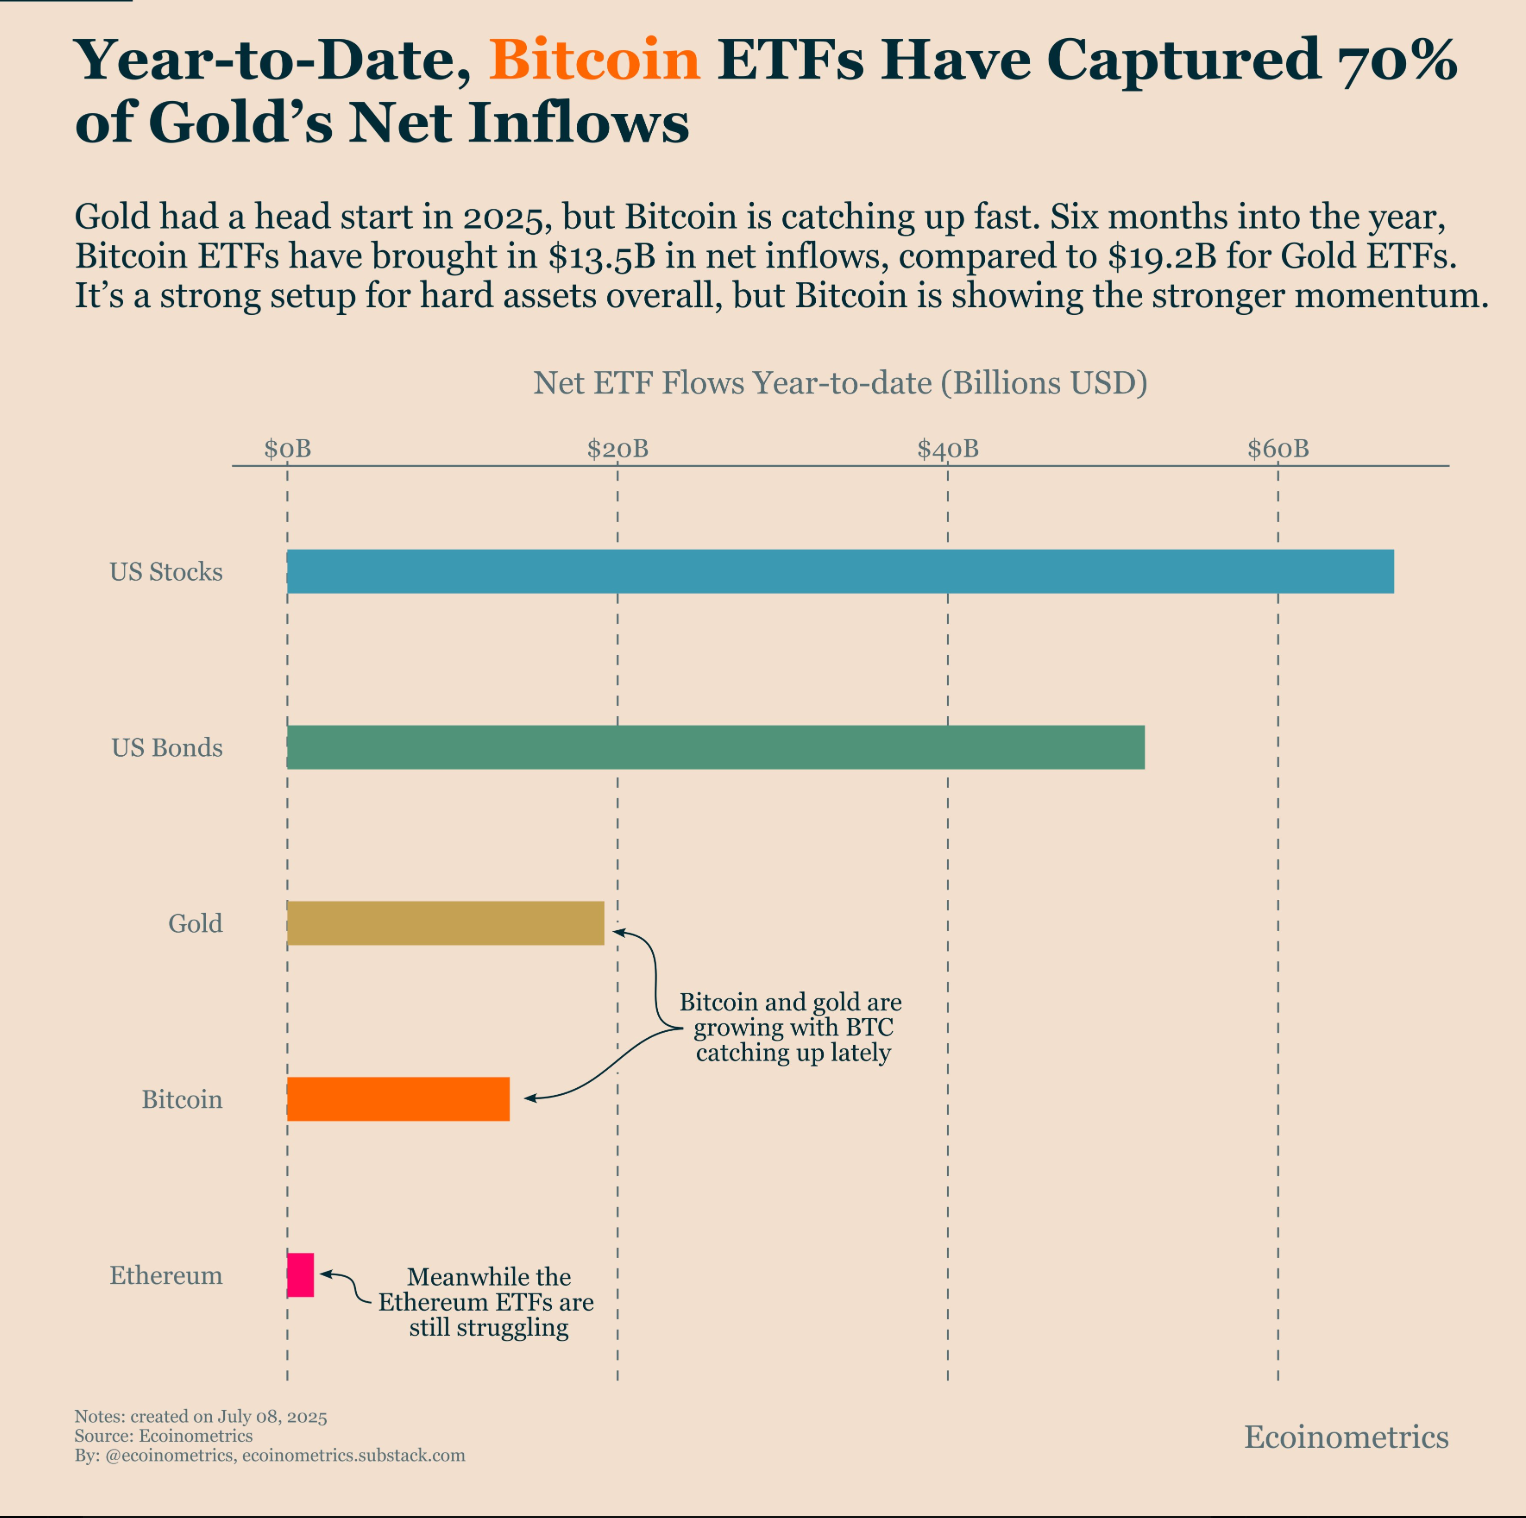
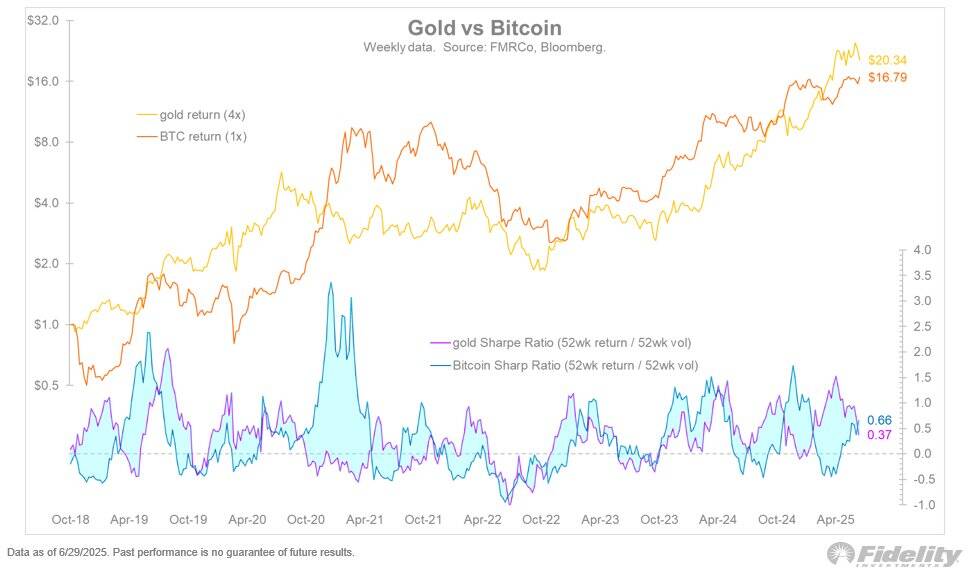
This rotation underscores rising institutional confidence in BTC as a legitimate store of value, a theme echoed by Fidelity’s Director of Global Macro, Jurrien Timmer.
Timmer recently noted that the “baton has swung back to Bitcoin,” pointing to the narrowing gap in Sharpe ratios. As of late June, Bitcoin’s Sharpe ratio stood at 0.66 versus gold’s 0.37, signaling superior risk-adjusted returns despite Bitcoin’s higher volatility.
Analyst apsk32 highlights that when denominated in gold ounces, Bitcoin’s current cycle hasn’t even started. His “Power Curve Cycle Cloud” model shows BTC still well below the historical upper bounds of the prior four-year cycles.
“In gold ounces, it looks like the cycle hasn’t even started,” apsk32 wrote, adding:
“This is keeping me open-minded to a peak well above $200K.”
In other words, if BTC continues to outperform gold—and the historical BTC/XAU to BTC/USD correlation holds—then a breakout to new all-time highs in dollar terms may still be in its early innings.
Bitcoin Price Forecast
Every new Bitcoin analysis as it publishes, today's technical signal and key levels, live price — on one page.
See all Bitcoin forecastsBitcoin Eyes 320% Gain Against gold, Fractal Suggests
A long-term ascending triangle breakout on the BTC/XAU chart suggests that Bitcoin could rise as much as 320% against gold in the coming quarters.
The pattern closely mirrors a similar consolidation structure from 2018–2020. Back then, BTC/XAU broke out of a symmetrical triangle and surged from approximately 4.5 to over 20, a gain of more than 340%, in under a year.
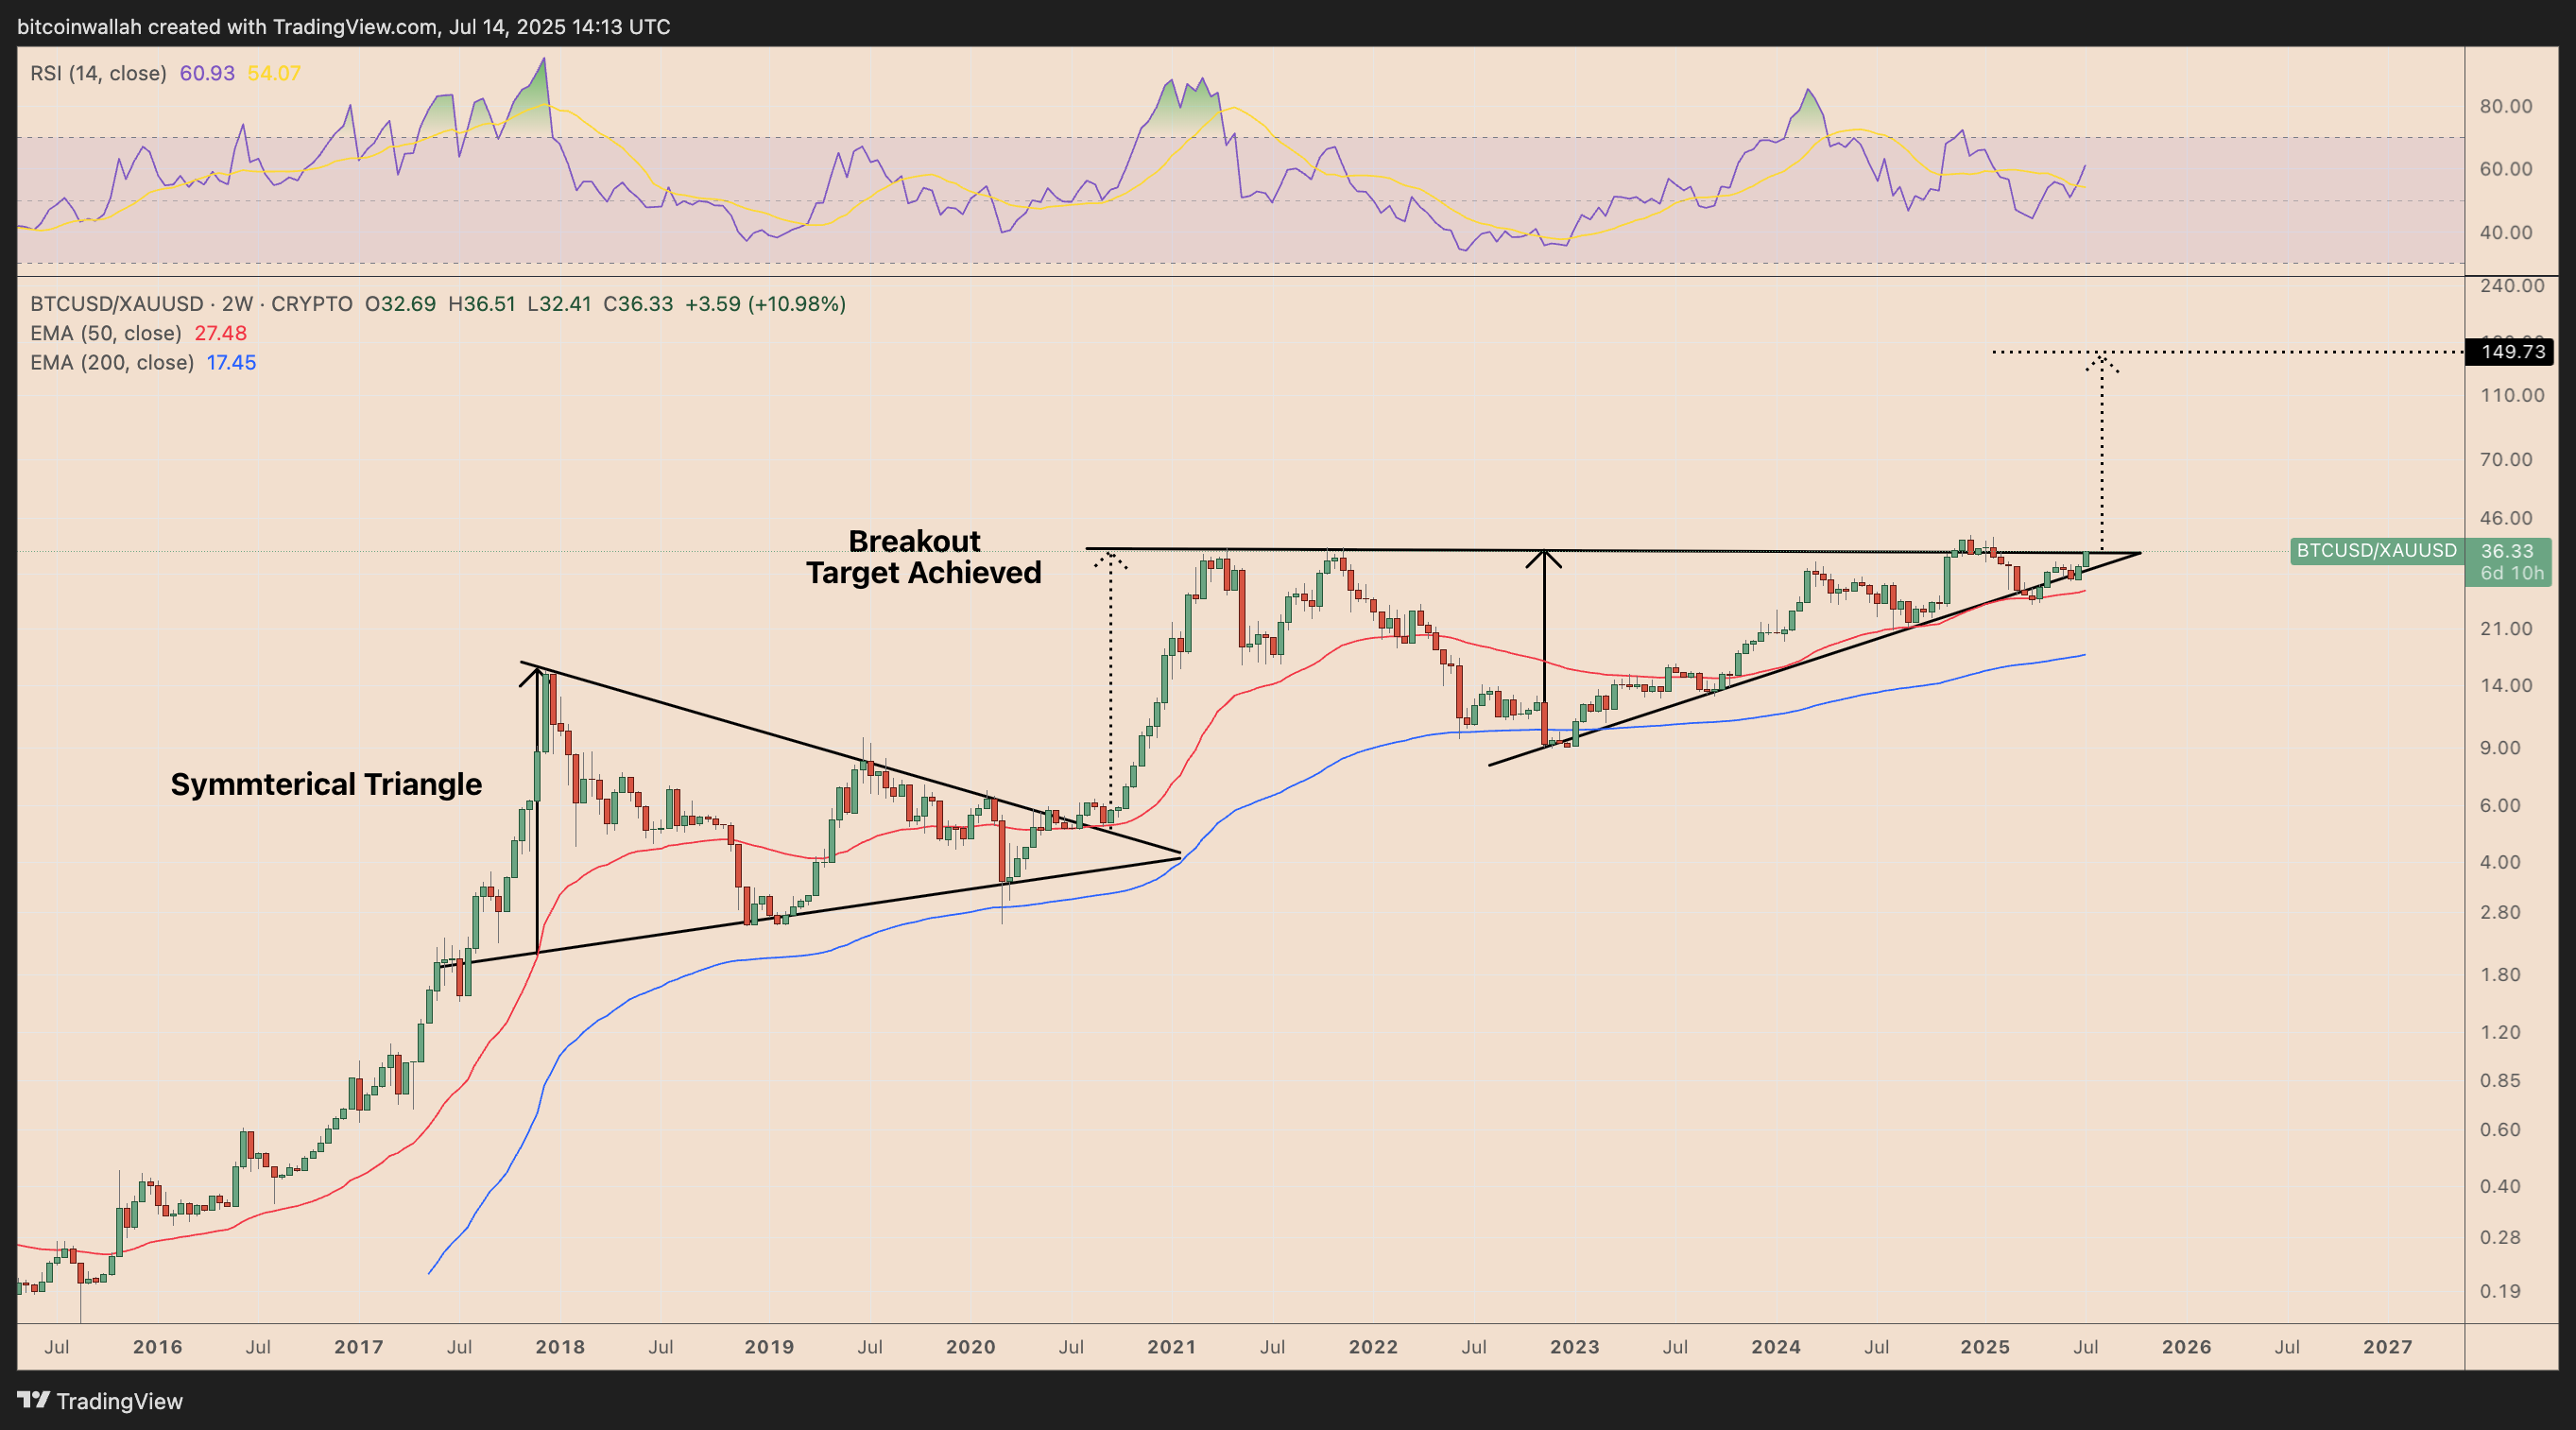
The rally reached its projected target almost to the dot, validating the pattern’s technical bias.
Now, BTC/XAU appears to be repeating the same setup, having spent the past three years forming a larger ascending triangle just below the 40.76 resistance level.
A breakout above this level would confirm the structure, with a measured move target near 149.73, implying a 320% upside from current levels around 36.33.