Bitcoin (BTC) is pressing against a short-term breakout level that could send its price above $68,000 this weekend if bulls defend a key long-term support zone.
Bitcoin Ascending Triangle Targets $68,000
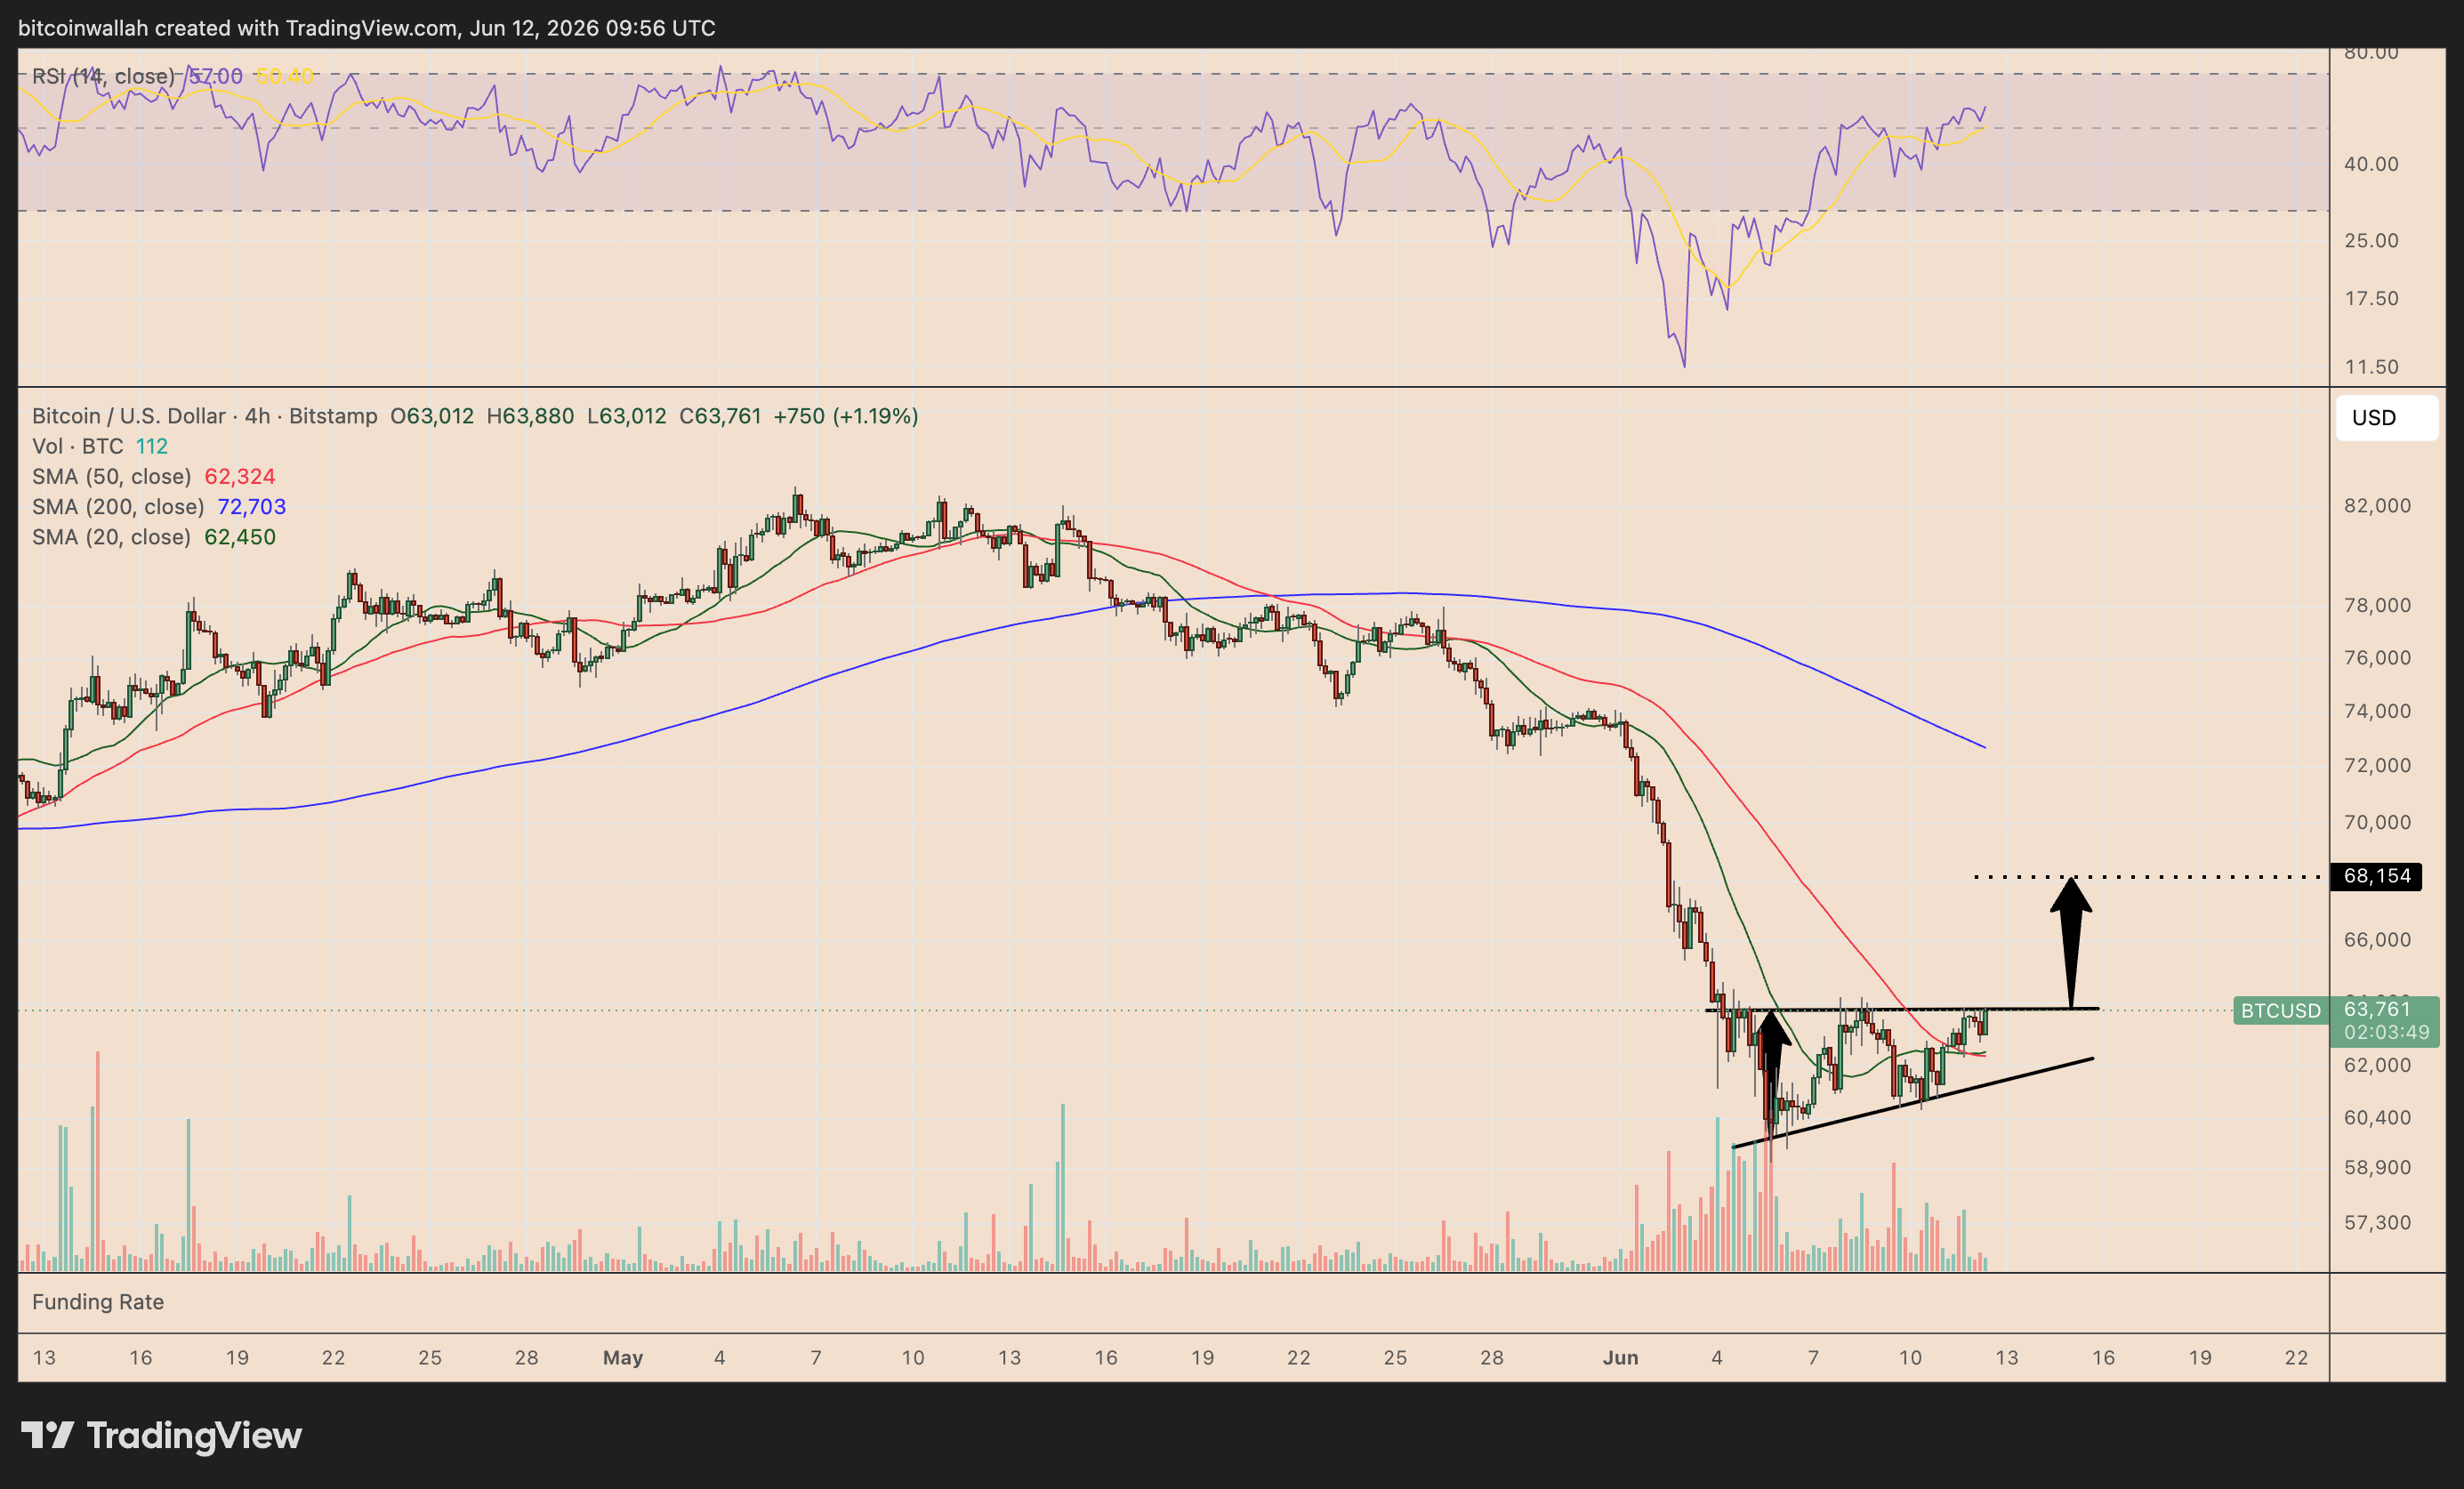
Bitcoin’s four-hour chart is building a short-term ascending triangle, with buyers defending higher lows while sellers continue to cap the rebound near the same resistance area.
The key breakout level sits around $63,800–$64,000, where BTC has failed multiple times since its sharp June 4 crash. Meanwhile, the rising trendline from the local low near $59,000 shows bulls stepping in at progressively higher prices.
That compression usually suggests selling pressure is weakening.
A clean four-hour close above $64,000 would confirm the ascending triangle breakout. Based on the pattern’s height, BTC’s measured upside target sits near $68,000–$68,200, matching the next major retest zone on the chart.
However, the move still needs confirmation. A rejection near $64,000 could keep BTC trapped inside the triangle, while a break below $62,000–$62,300 would weaken the bullish setup and expose $60,000 again.
Bitcoin Price Forecast
Every new Bitcoin analysis as it publishes, today's technical signal and key levels, live price — on one page.
See all Bitcoin forecastsBitcoin Bulls Defend 200-Week SMA
The bullish short-term setup is forming as BTC attempts to hold its 200-week SMA (blue) near $62,000, one of Bitcoin’s most important long-term support levels.
BTC’s first major bottom formed near $60,000 after the early-2026 selloff. The latest retest of the same area now raises the possibility of a double-bottom pattern, especially because sellers have not yet pushed the price decisively below the first low.
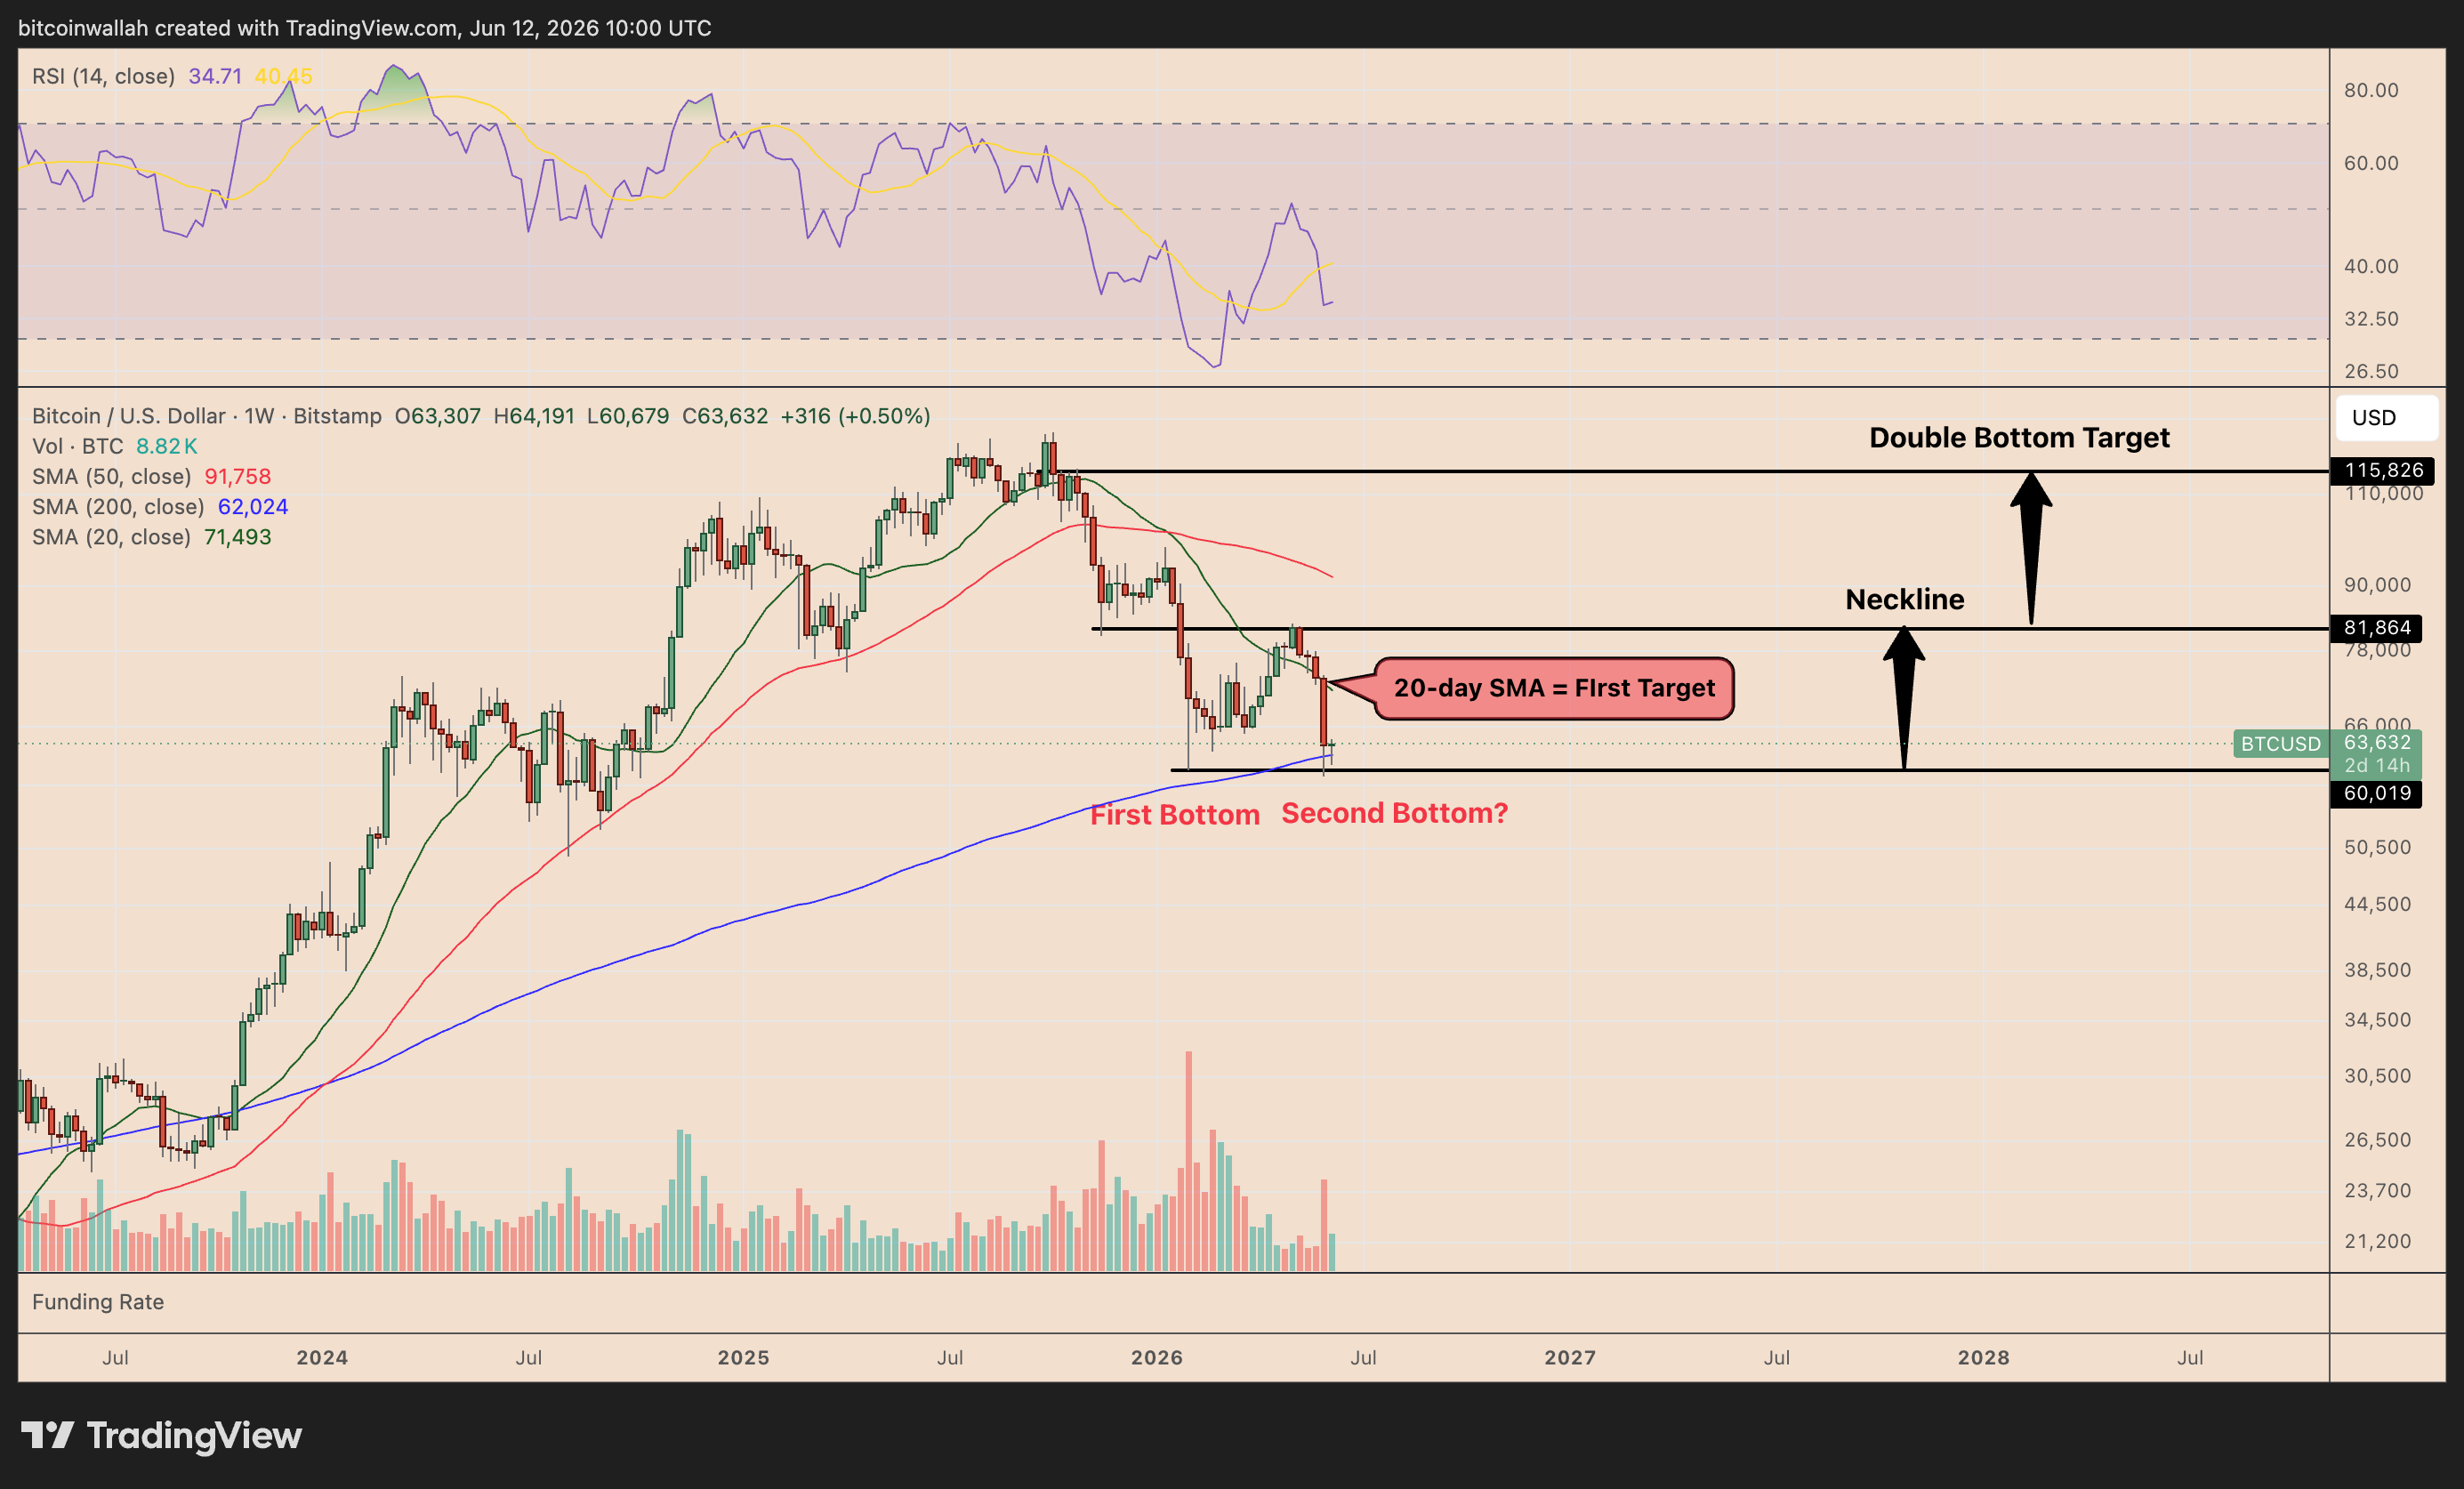
If BTC continues to hold above the 200-week SMA, the first upside target sits near the 20-week SMA around $71,500. A stronger recovery above that level could open the door to a retest of the double-bottom neckline near $81,800–$82,000.
A weekly close above the neckline would confirm the larger reversal setup. Based on the pattern’s height, BTC could then eye a long-term target near $115,000–$116,000.
For now, though, the setup remains early. BTC still trades below its 20-week and 50-week SMAs, while the weekly RSI near 35 shows weak broader momentum.
Bear Flag Risk Remains Below $62K
The 200-week SMA remains BTC’s main line in the sand.
A weekly close below $62,000, followed by acceptance under $60,000, would invalidate the double-bottom setup and activate the bear flag breakdown on the weekly chart.
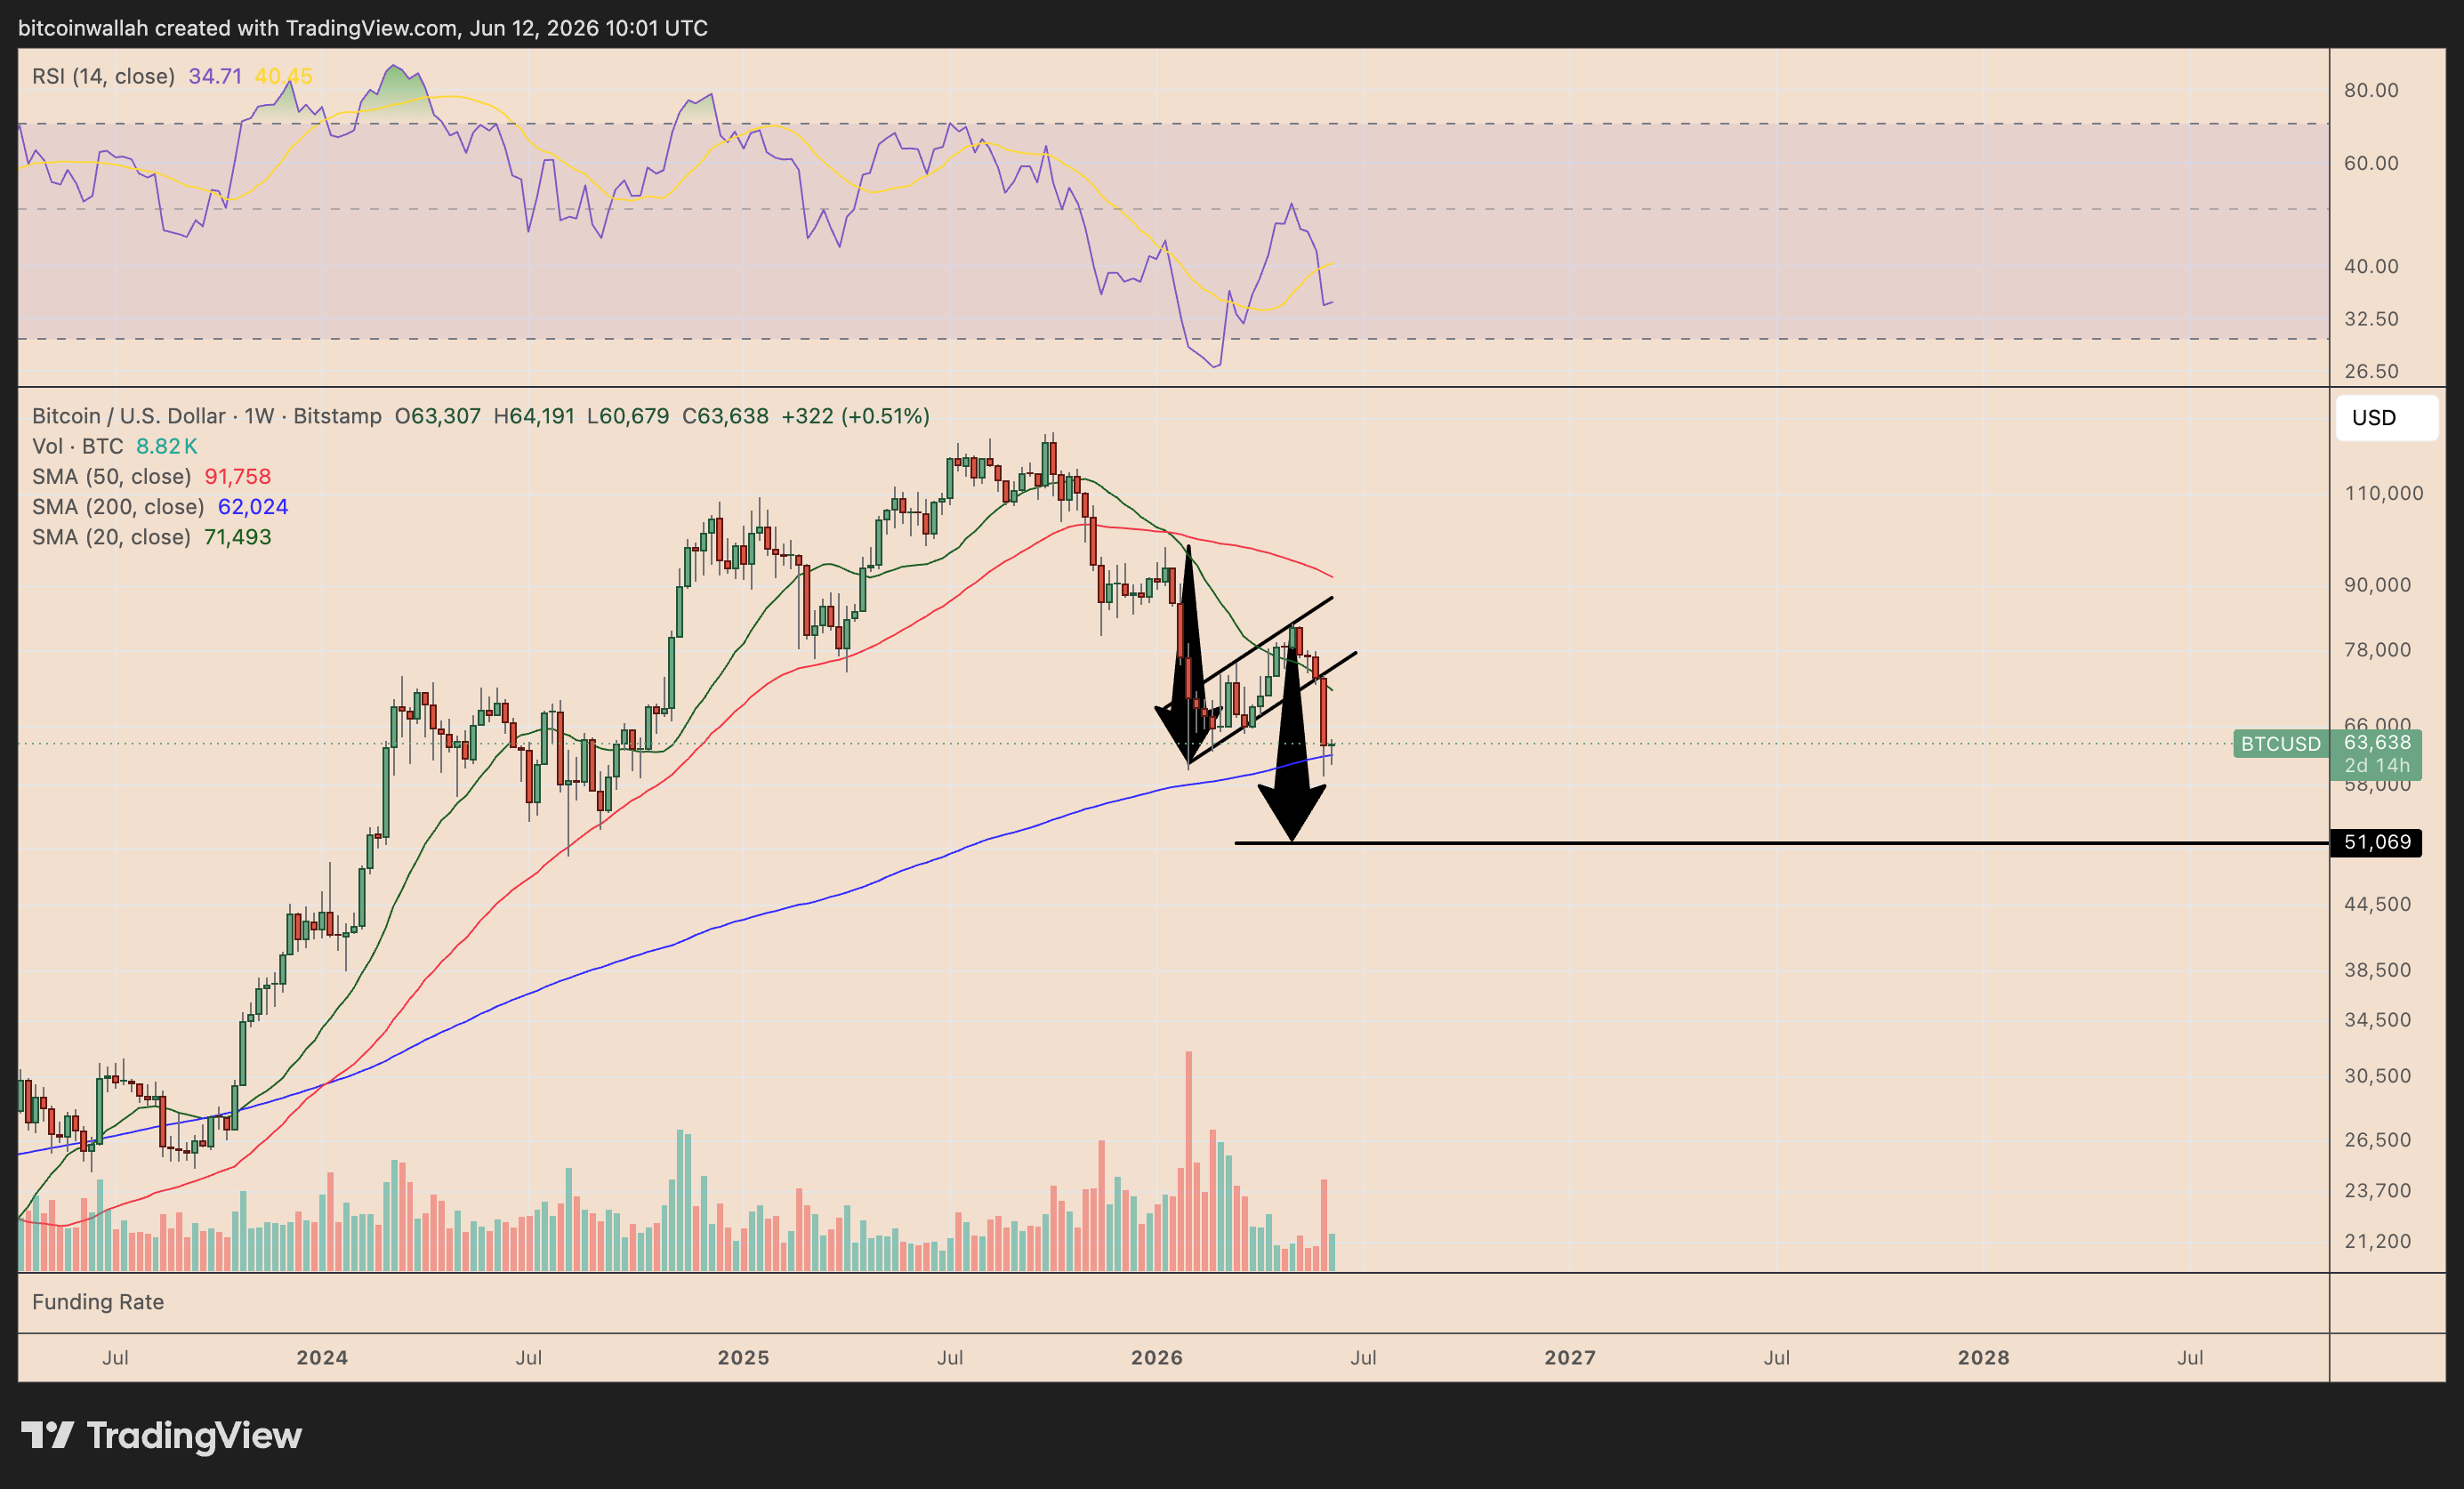
If confirmed, the pattern’s measured downside target sits near $51,000.
In other words, Bitcoin can still rally above $68,000 this weekend if the four-hour triangle breaks higher. But bulls must defend $62,000–$60,000 to keep the broader recovery setup alive.