
SP500 Tested The 7400 Level
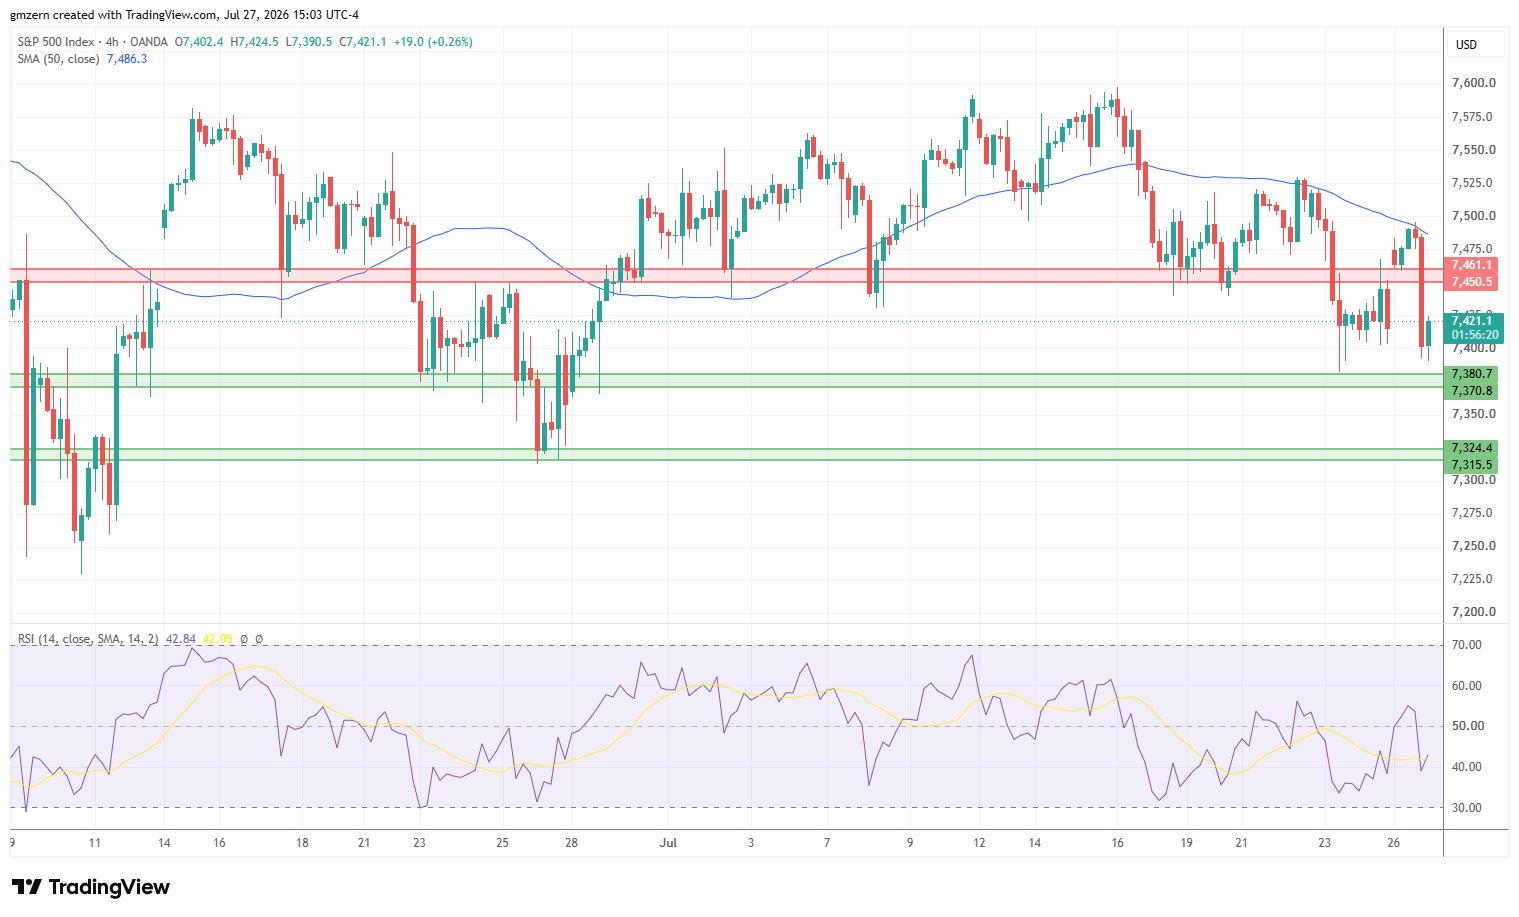
SP500 pulled back from session highs as traders reacted to economic reports and focused on the sell-off in the oil markets.
Durable Goods Orders increased by +0.3% month-over-month in june, compared to anlayst forecast of +2.5%. Durable Goods Orders Ex Transp increased by +0.6%, while analysts expected that they would grow by +0.8%.
Traders also focused on the Dallas Fed Manufacturing Index report. The report showed that Dallas Fed Manufacturing Index improved from 0.0 in June to +1.3 in July, compared to analyst consensus of -1.
WTI oil pulled back by -9% as U.S. and Iran halted strikes and started negotiations. President Trump said that there was a good chance for a deal. He added that U.S. was ready to resume the military operation against Iran in case negotiations yielded no results. Oil traders bet that U.S. and Iran could announce a temporary deal that would reopen the Strait of Hormuz.
Treasury yields moved lower as bond traders focused on the pullback in the oil markets. It should be noted that lower Treasury yields did not provide material support to SP500.
Not surprisingly, energy stocks were among the biggest losers in the SP500 index today. Traders sold energy stocks amid strong sell-off in the oil markets. Tech stocks have also found themselves under pressure. Consumer defensive and consumer cyclical stocks gained ground amid sector rotation.
SP500 failed to settle above the resistance level at 7450 – 7460 and pulled back towards the 7400 level. In case SP500 manages to settle below 7400, it will head towards the nearest support, which is located in the 7370 – 7380 range. A move below the 7370 level will push SP500 towards the next support at 7315 – 7325. RSI is in the moderate territory, so there is plenty of room to gain momentum in the near term.

NASDAQ Tested New Lows As Pullback Continued
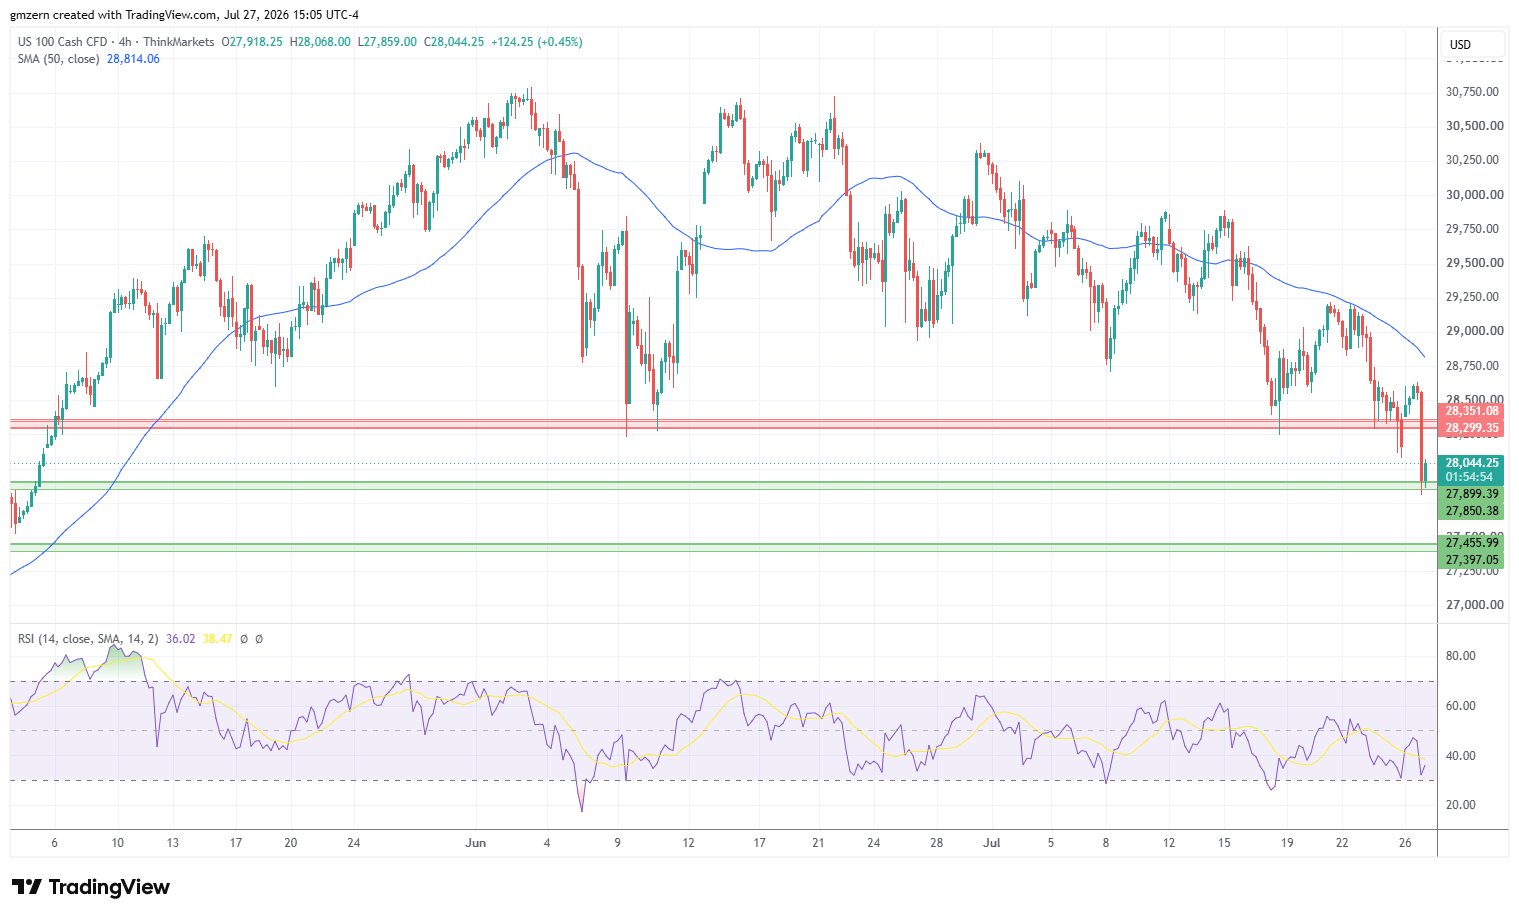
From the technical point of view, NASDAQ attempts to settle below the support at 27,850 – 27,900. In case this attempt is successful, NASDAQ will head towards the next support level, which is located in the 27,400 – 27,450 range. On the upside, a move above the 28,100 level will push NASDAQ towards the nearest resistance level at 28,300 – 28,350.
Dow Jones Price Forecast
Every new Dow Jones analysis as it publishes, today's technical signal and key levels, live price — on one page.
See all Dow Jones forecastsDow Jones Moved Away From Session Highs
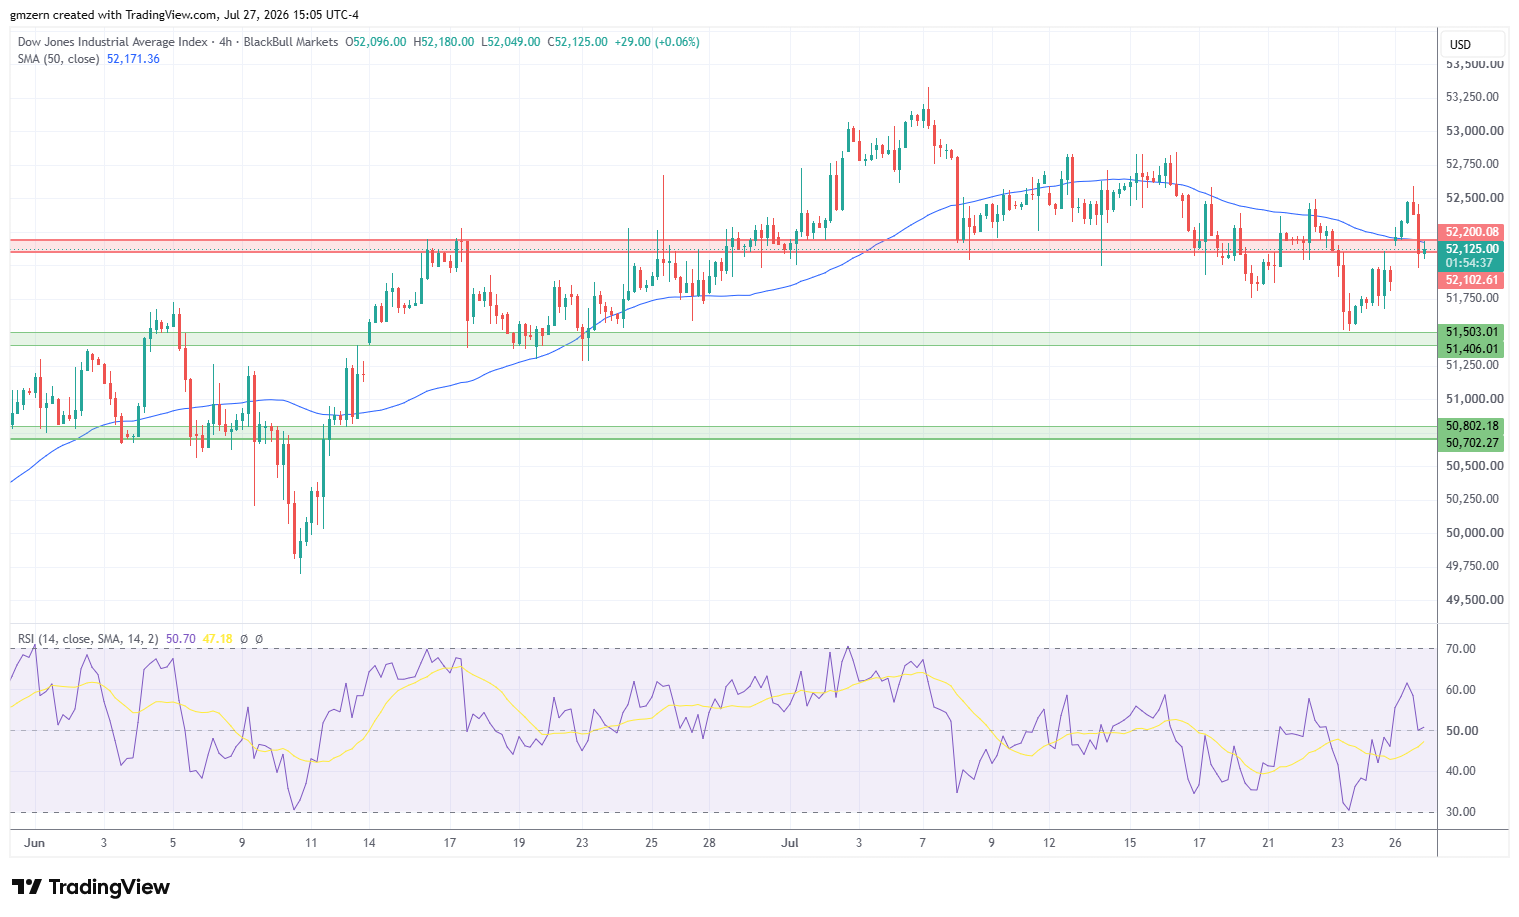
Dow Jones pulled back from session highs but remained in the positive territory. The strong sell-off in the oil markets provided material support to the Dow Jones index. Most stocks in the index moved higher in today’s trading session.
Salesforce, which was up by +7%, was the biggest gainer in the Dow Jones index today. The stock rallied amid rising demand for software stocks.
Dow Jones needs to settle above the resistance at 52,100 – 52,200 to gain upside momentum in the near term. A move above the 52,200 level will push Dow Jones towards the 52,600 level.
For a look at all of today’s economic events, check out our economic calendar.