


Spot Gold Rallies as Oil Slide Unwinds the Post-Fed Selloff
The Fed raised rates 25 basis points to 3.75%-4.00% on Wednesday and gold finished the week higher. That is the story. The rate decision was supposed to keep sellers in control. It lasted one session. By Friday crude was falling for a third day, the 10-year had backed off from the 5% level it hit earlier in the week and the dollar had run out of reasons to keep climbing. Gold did not need the Fed to turn dovish. It needed the trade behind the hike to stop working and that is exactly what happened.
Spot Gold (XAUUSD) settled at $4,378.385 on Friday, up $36.545 or 0.84%. The session high was $4,399.67 and the low was $4,334.295.

Daily Spot Gold (XAUUSD) Technical Analysis
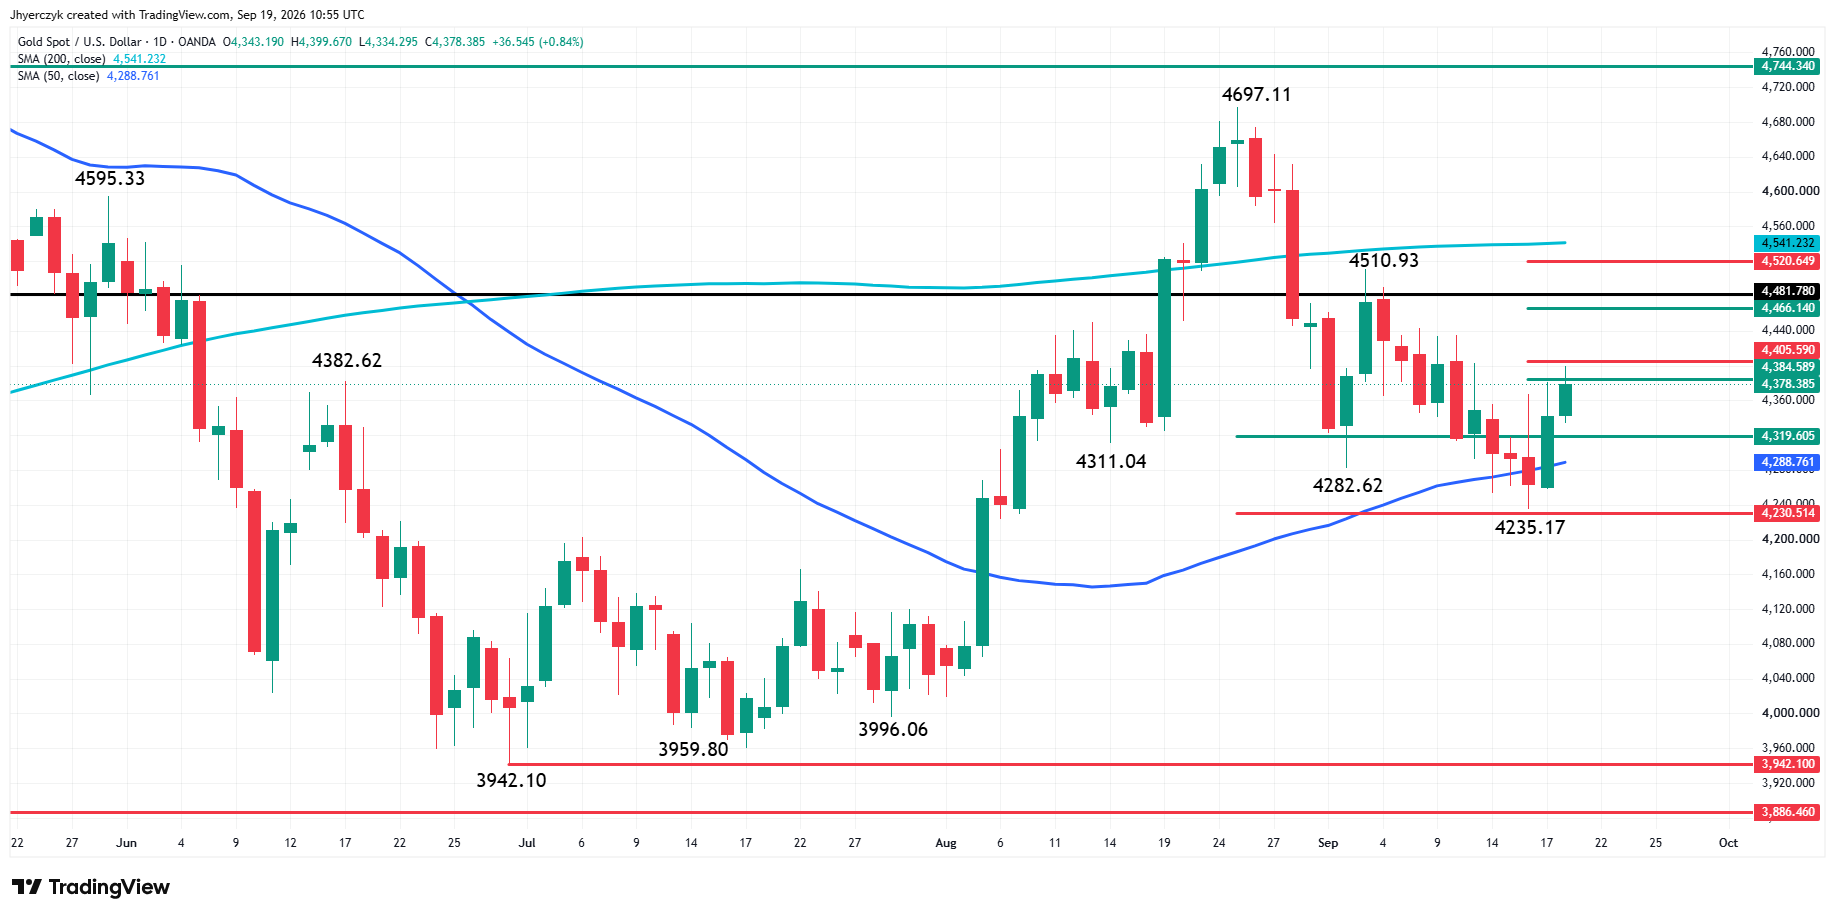
Spot Gold edged higher on Friday. Although gold moved beyond Thursday’s high at $4,381.07, it struggled to attract follow-through buying after testing a minor retracement zone at $4,373.05 to $4,405.59.
The main trend is down according to the daily swing chart, however, momentum has turned higher following a change in the minor trend and a move to the strong side of the 50-day moving average at $4,288.76.
The main trend will turn up on a trade through the swing top at $4,510.93. A trade through $4,235.17 will signal a resumption of the downtrend.
Intermediate support at $4,319.60 to $4,230.51 held earlier in the week when Spot Gold reached its current bottom at $4,235.17.
The downswing from $4,510.93 to $4,235.17 created a minor retracement zone at $4,373.05 to $4,405.59. The larger downswing from $4,697.11 to $4,235.17 created a second resistance zone at $4,466.14 to $4,520.65. The 200-day moving average at $4,541.23 is additional overhead resistance.
Gold Price Forecast
Every new Gold analysis as it publishes, today's technical signal and key levels, live price — on one page.
See all Gold forecastsCrude Gave Gold Its Opening
Oil had been the backbone of the inflation case all week. The damage to Saudi Arabia’s East-West pipeline and the disruption at Yanbu sent crude sharply higher and gave the rate hike its strongest outside argument. By Friday that argument was losing ground. Saudi Arabia was shipping barrels through Oman. China’s refined-fuel exports were rising. Product inventories built in the U.S., Singapore and Europe. The immediate fear that another energy spike was about to force more tightening cooled enough to bring gold buyers back before the data confirmed the shift.
The Hike Expired Fast
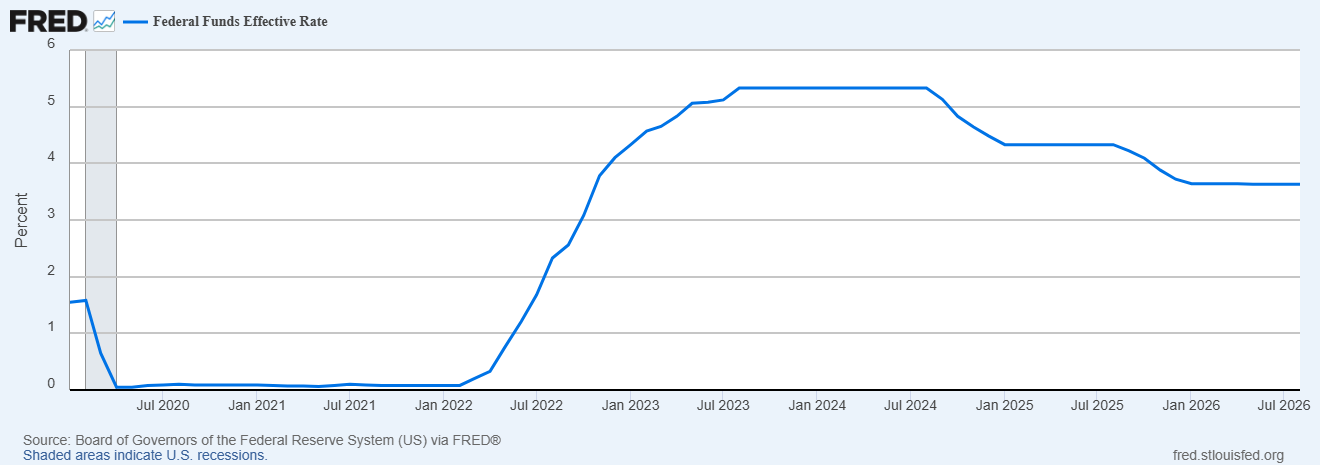
The Fed’s first rate increase in three years knocked gold lower Wednesday. Thursday the selling was done. Friday the metal closed higher. That is a fast expiration date for a hawkish meeting and it tells you the short side was more crowded than convinced. The rate decision gave sellers a clean reason to act. It did not give them enough fresh pressure to stay in the trade once crude started falling and yields stopped making new highs. Gold absorbed the hike and moved on. That is not what a market looks like when a tightening cycle is gaining momentum.
The Pressure Stopped Getting Worse and That Was Enough
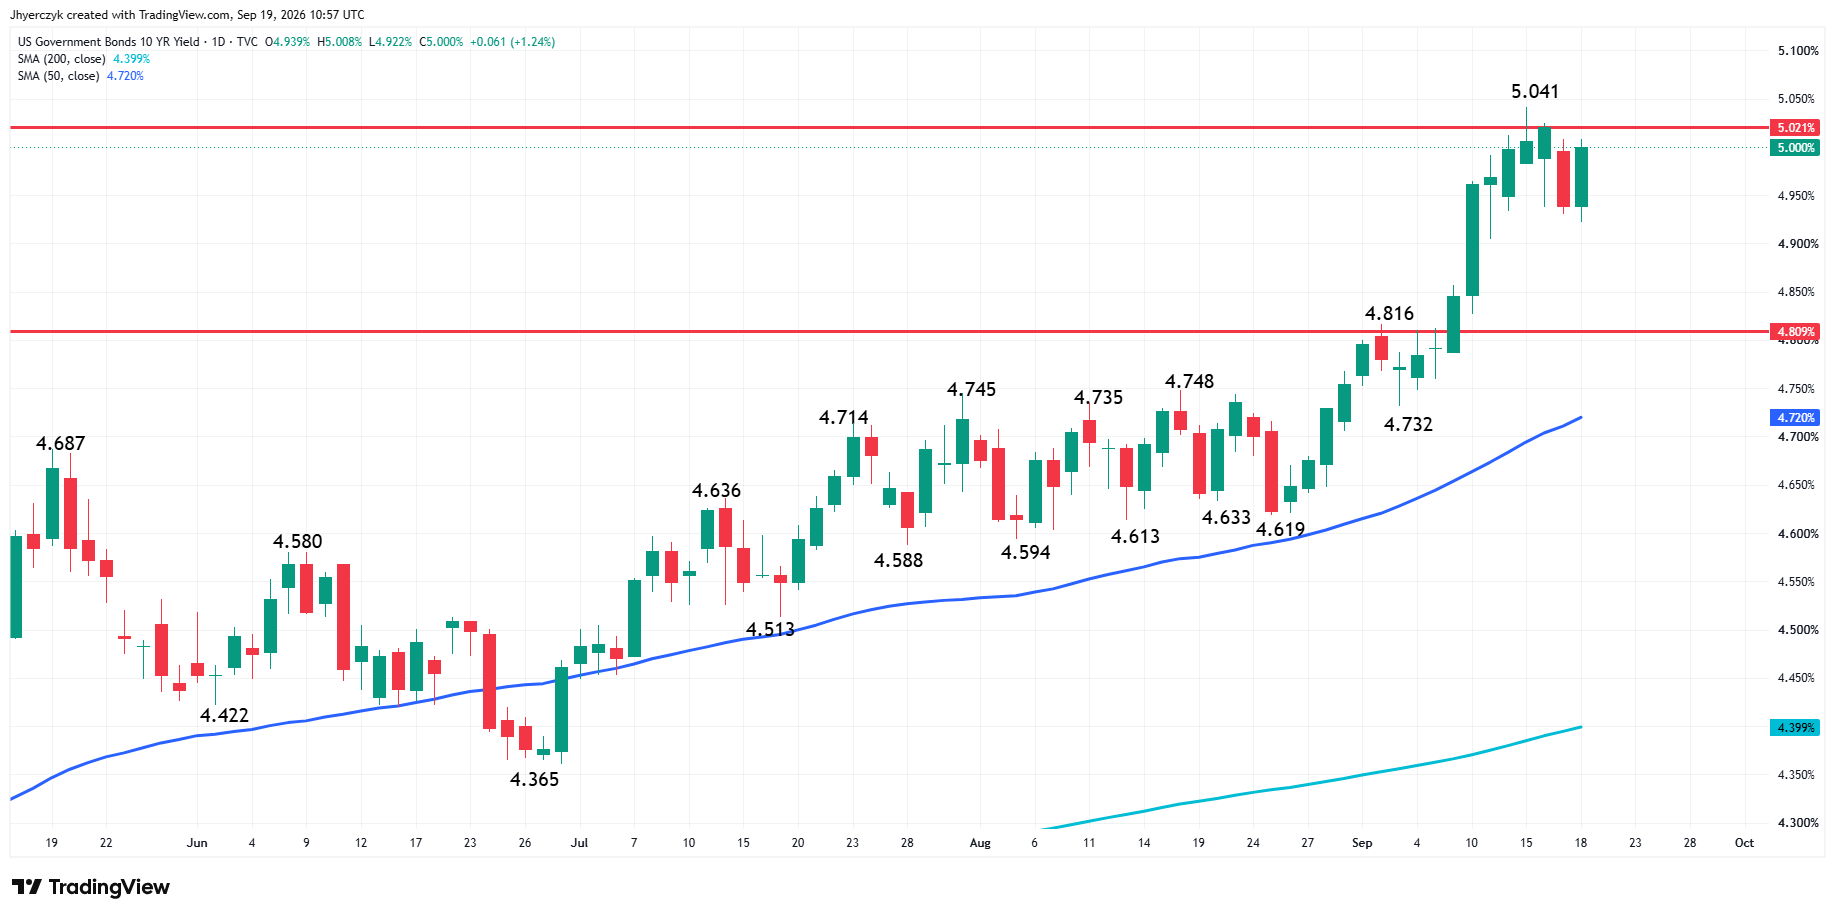
The 10-year hit 5% earlier in the week. By Friday it was sitting near that level without extending. The dollar index held near a multi-week high but was not launching a new leg. Gold has been trading against yields and the dollar all week. Friday was the first session where neither one was actively making a new high while gold was trying to rally. The short side ran out of new ammunition and the result was a move from $4,334.295 to $4,399.67 in one session.
The Weekend Still Carries War Risk
Visible vessel traffic through the Strait of Hormuz remains far below normal. Saudi infrastructure is damaged. The conflict between Iran, Saudi Arabia and the Houthis is active. Washington and Tehran have not restarted peace talks. A more reliable Saudi route through Oman eases the immediate supply panic. It does not guarantee the next attack misses loading infrastructure. The oil correction gave gold its rally Friday. A weekend escalation puts crude right back at the highs and gold would have to deal with the inflation argument all over again on Monday.
What to Watch
Crude has to stay below this week’s highs for gold to keep the ground it gained Friday. A renewed push in oil prices brings the inflation argument back and gives yields a reason to break above 5% again. That would put the entire post-Fed relief trade at risk. The weekend is the immediate threat. The conflict is active and one headline from the Strait can reverse three days of falling crude before Monday’s open.
The bias leans bearish with the main trend still down on the daily swing chart, however, the move through the 50-day moving average at $4,288.76 and the minor trend change have taken the conviction out of the bearish case. The minor retracement zone at $4,373.05 to $4,405.59 is the pivot. Friday stalled there. A sustained push through $4,405.59 opens the larger zone at $4,466.14 to $4,520.65 with the 200-day at $4,541.23 above it and that is where the trend change conversation starts.
On the downside, losing $4,373.05 hands control back to sellers with $4,319.60, the 50-day at $4,288.76 and the main bottom at $4,235.17 as the levels that have to hold or the recovery was short covering and nothing more.
If you’d like to know more about how to trade gold, please visit our educational area.


