
Advertisement
Advertisement
Comex Gold Futures (GC) Technical Analysis – October 30, 2014 Forecast
By:
December Comex Gold futures traders reacted the way they should to yesterday’s slightly hawkish U.S. Federal Open Market Committee announcement by selling
December Comex Gold futures traders reacted the way they should to yesterday’s slightly hawkish U.S. Federal Open Market Committee announcement by selling the precious metal.
Fed policymakers implied in their latest statement that the central bank was moving toward a tighter monetary policy more quickly than its counterparts in the U.K. and Euro Zone. This helped boost the U.S. Dollar which put pressure on the gold market.
Although gold straddled a major retracement zone on Wednesday, this area remains significant to the structure of the market today and over the near-term. This is because holding it could mean a potentially bullish secondary higher bottom is forming while taking it out with conviction will likely lead to increased selling pressure.
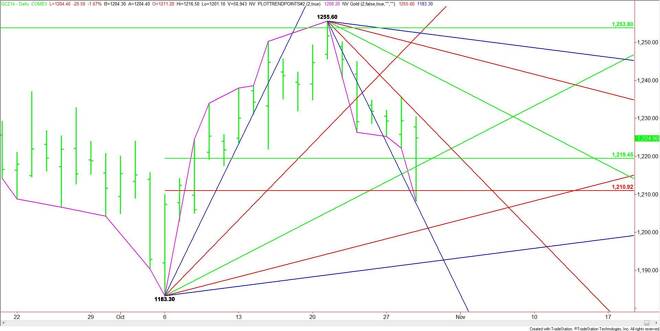
The main range is $1183.30 to $1255.60, making its retracement zone at $1219.40 to $1211.00 the significant area to watch for future direction. Simply stated, holding $1219.40 will set a bullish tone while taking out $1211.00 will set a negative tone. In between the numbers will indicate investor uncertainty.
On the upside, the nearest resistance is an angle coming down from the $1255.60 top. This angle has been controlling the direction of the market since October 21. It is at $1227.60 today.
On the downside, the first support angle is at $1219.30. This angle forms a support cluster with the 50% level at $1219.40. This area is the trigger point for volatility because buyers like to come in at a support cluster during bullish markets and long traders like to place stops under areas like this. So we will see a significant bounce off this area if the buyers are there, or a sharp break if the sell stops get triggered.
If $1219.30 is taken out with conviction then look for a sharp break into the next Fibonacci price target at $1211.00. This is followed by another angle at $1201.30.
The tone of the day will be determined by how investors handle a test of $1219.40 to $1219.30.
About the Author
James Hyerczykauthor
James Hyerczyk is a U.S. based seasoned technical analyst and educator with over 40 years of experience in market analysis and trading, specializing in chart patterns and price movement. He is the author of two books on technical analysis and has a background in both futures and stock markets.


Advertisement