



Commodities prices continue to be investors’ safe haven as political uncertainty and weaker than expected economic data raised investors concerns.
Falling crude oil prices for the fifth weekly loss pulled commodity prices down as oversupply continued the ‘black gold’ downtrend.
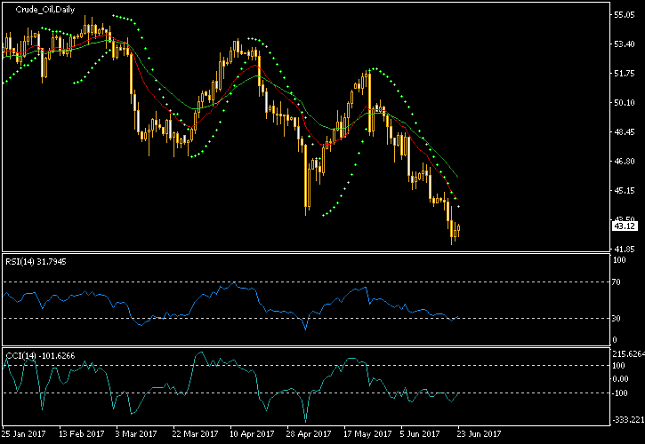
The technical analysis, that includes the indicators’ data and major pivot points for WTI Oil, Gold, Silver and Copper as traded on spot market as of June 25th, 2017:

Crude Oil
Indicators
Moving Averages |
RSI |
Parabolic SAR |
CCI |
| Short | Neutral | Short | Short |
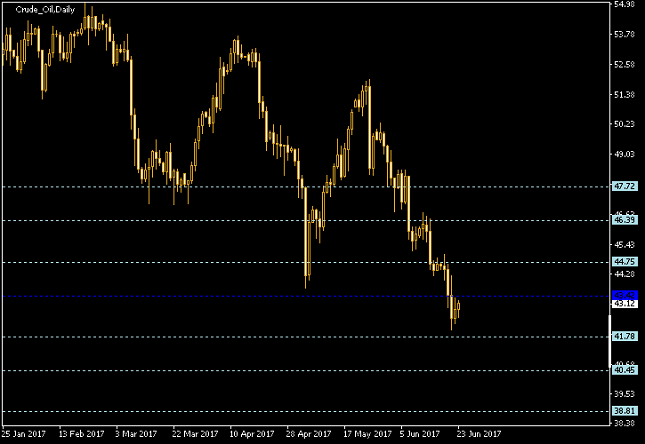
Floor Pivot Points
3rd Sup |
2nd Sup |
1st Sup |
Pivot |
1st Res |
2nd Res |
3rd Res |
| 38.81 | 40.45 | 41.78 | 43.42 | 44.75 | 46.39 | 47.72 |
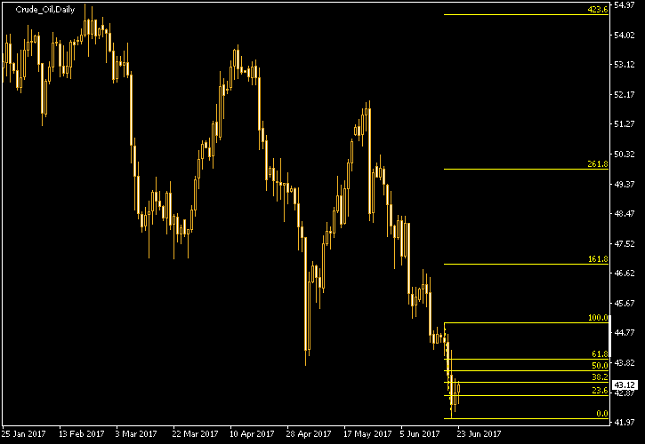
Fibonacci Retracement Levels
0.0% |
23.6% |
38.2% |
50.0% |
61.8% |
100.0% |
| 42.08 | 42.78 | 43.21 | 43.57 | 43.92 | 45.05 |
Gold
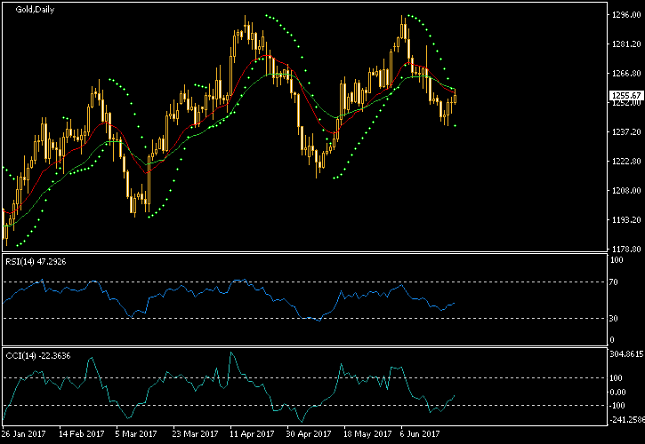
Indicators
Moving Averages |
RSI |
Parabolic SAR |
CCI |
| Short | Neutral | Long | Neutral |
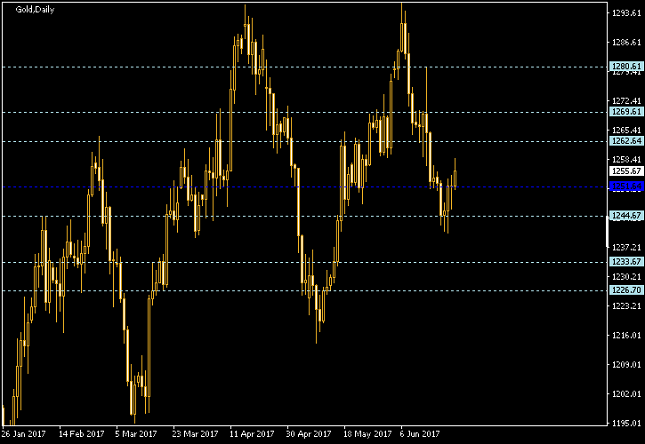
Floor Pivot Points
3rd Sup |
2nd Sup |
1st Sup |
Pivot |
1st Res |
2nd Res |
3rd Res |
| 1226.70 | 1233.67 | 1244.67 | 1251.64 | 1262.64 | 1269.61 | 1280.61 |
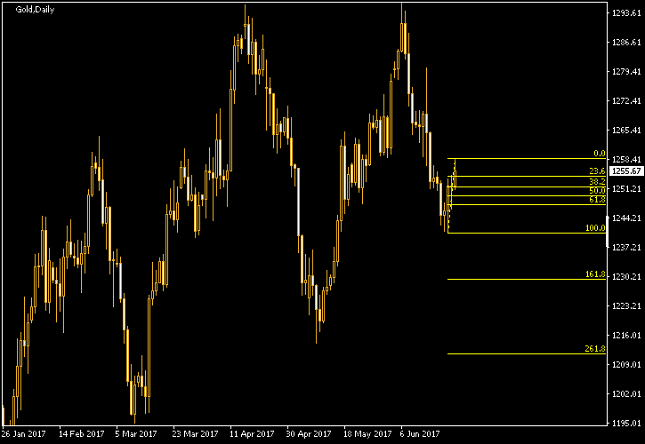
Fibonacci Retracement Levels
0.0% |
23.6% |
38.2% |
50.0% |
61.8% |
100.0% |
| 1240.64 | 1244.88 | 1247.50 | 1249.63 | 1251.75 | 1258.61 |
Silver
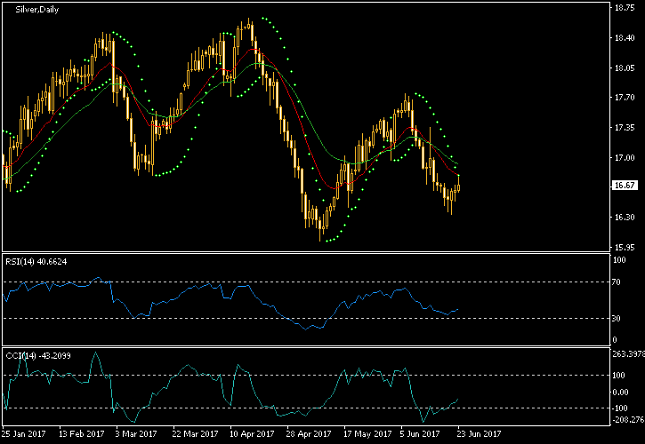
Indicators
Moving Averages |
RSI |
Parabolic SAR |
CCI |
| Short | Neutral | Short | Neutral |
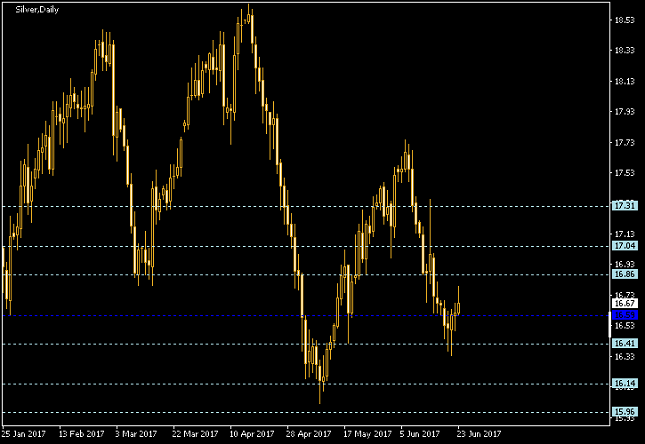
Floor Pivot Points
3rd Sup |
2nd Sup |
1st Sup |
Pivot |
1st Res |
2nd Res |
3rd Res |
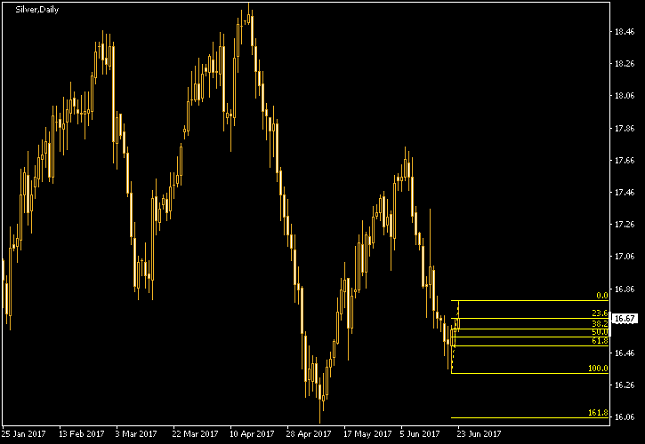
| 15.96 | 16.14 | 16.41 | 16.59 | 16.86 | 17.04 | 17.31 |
Fibonacci Retracement Levels
0.0% |
23.6% |
38.2% |
50.0% |
61.8% |
100.0% |
| 16.33 | 16.44 | 16.50 | 16.56 | 16.61 | 16.78 |
Copper
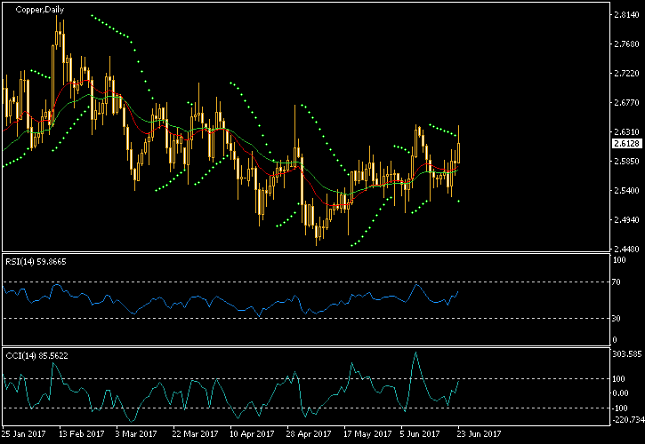
Indicators
Moving Averages |
RSI |
Parabolic SAR |
CCI |
| Long | Neutral | Long | Neutral |
Floor Pivot Points
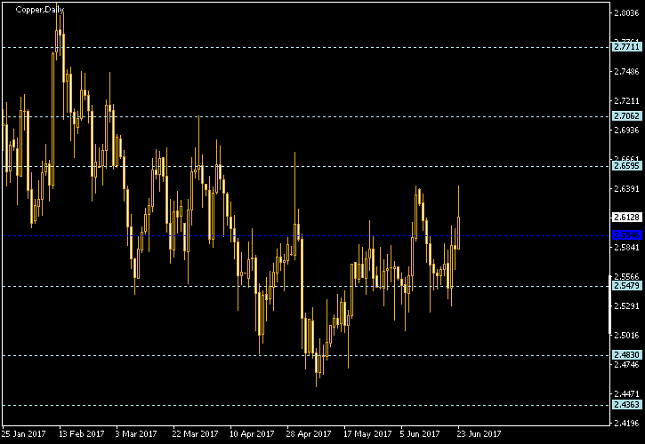
3rd Sup |
2nd Sup |
1st Sup |
Pivot |
1st Res |
2nd Res |
3rd Res |
| 243.63 | 248.30 | 254.79 | 259.46 | 265.95 | 270.62 | 277.11 |
Fibonacci Retracement Levels
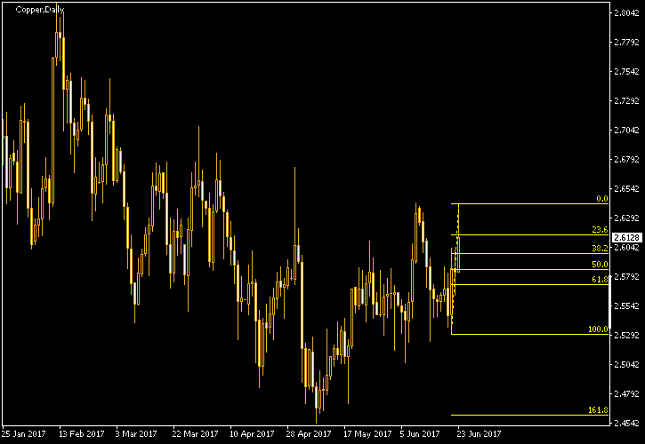
0.0% |
23.6% |
38.2% |
50.0% |
61.8% |
100.0% |
| 252.97 | 255.60 | 257.23 | 258.55 | 259.87 | 264.13 |
This post was originally published by EarnForex


