
Advertisement
Advertisement
Crude Oil Forecast February 28, 2017, Technical Analysis
Updated: Feb 28, 2017, 08:47 GMT+00:00
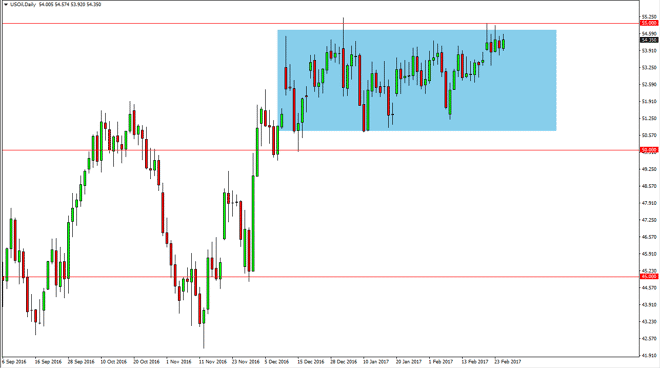
WTI Crude Oil The WTI Crude Oil markets continue to show bullish pressure against the $55 handle above, but still can’t break to the upside. Because of
WTI Crude Oil
The WTI Crude Oil markets continue to show bullish pressure against the $55 handle above, but still can’t break to the upside. Because of this, I think that we will continue to see sellers jump into this market every time we get a little too close to the important $55 level, and that should keep the markets interesting. With this in mind, I’m looking for exhaustive candles on short-term charts as we approach that level. I’m looking for short-term scalping opportunities, not a larger position necessarily. However, if we did break above the $55 level, at that point I believe that the market within try to reach towards the $60 level. Needless to say, the choppiness should continue as there are so many moving parts at the moment.
Crude Oil Price Forecast Video 28.2.17
Watch our Crude Oil Video Forecast:
Brent
Brent markets continue to chop around as well, with the $57.50 level being the culprit. That’s an area that I think will continue to be resistive, but if we can break above there the market should then continue to go even higher. The markets also have a bit of support at the $55 level, and then underneath there at the $53.50 level. No matter what happens, this is going to be a choppy market as we have seen over the last couple of months. Quite frankly, this is the type of situation that benefits options traders, as the lack of volatility should continue to offer opportunities to straddle the market. Currently, I do not expect anything like a large move, as there are so many different conflicting opinions.
For myself, I still believe in the bearish story but I think it’s going to take a while to get there. Once we break down below the $53 level, the downtrend it should start to pick up. Alternately, if we do breakout to the upside the $60 level would be the next psychologically significant resistance barrier. That would be the target of the buyers, but quite frankly the oversupply continues, so I cannot help but wonder how long the market can ignore that major problem.
About the Author
Christopher Lewisauthor
Chris is a proprietary trader with more than 20 years of experience across various markets, including currencies, indices and commodities. As a senior analyst at FXEmpire since the website’s early days, he offers readers advanced market perspectives to navigate today’s financial landscape with confidence.


Advertisement