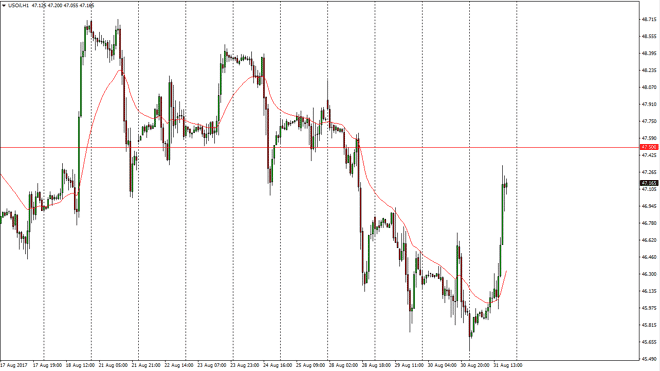
WTI Crude Oil The WTI Crude Oil market broke to the upside on Thursday, reaching towards the $47.25 level. I see resistance at the $47.50 level, and with
The WTI Crude Oil market broke to the upside on Thursday, reaching towards the $47.25 level. I see resistance at the $47.50 level, and with today being Nonfarm Payroll Friday, it’s likely that we will see volatility. If we break above the $47.50 level, all bets are off as it could continue to the upside. However, this market is getting a bit stretched already, so I don’t think it’s good to take much to turn things around. I would be very hesitant to get involved here, as shorting is going to be difficult, but buying at this level is going to be chasing the trade. Ultimately, if you have missed the move to the upside during the day on Thursday, there’s no need to get involved in this market until we see some type of resistive candle telling you it’s time to start shorting again.
Brent markets shot straight up in the air, reaching the $52.50 level. Because of this, the resistance looks to be tested, but I don’t think we are going to be able to break above a right away. After all, this is a market that has gained $2.50 a barrel and just a few short hours, but if we were to break above the $52.75 level, that would be an extraordinarily strong move. That would probably change the overall trend of oil in general, so I believe the next 24 hours are going to be vital. With this in mind, I’m looking for some type of exhaustion to start selling, but if we get that break out, one would have to look for a pullback and signs of support to get involved to the upside. I believe that we will see a serious long-term effects in this market over the next several days. Be careful, this is going to get dangerous quick.
Chris is a proprietary trader with more than 20 years of experience across various markets, including currencies, indices and commodities. As a senior analyst at FXEmpire since the website’s early days, he offers readers advanced market perspectives to navigate today’s financial landscape with confidence.