
Advertisement
Advertisement
Crude Oil forecast for the week of February 27, 2017, Technical Analysis
Updated: Feb 25, 2017, 05:45 GMT+00:00
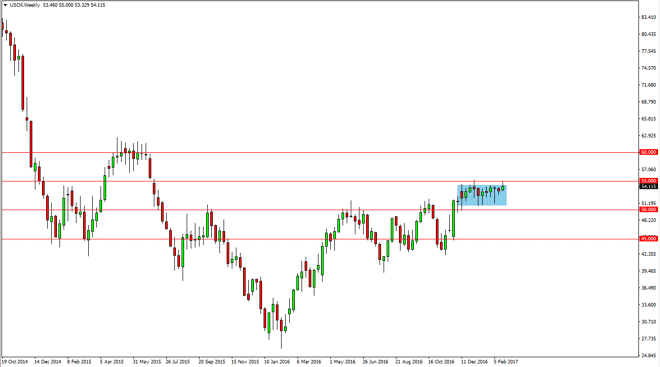
WTI Crude Oil The WTI Crude Oil market initially tried to rally during the week but continues to struggle at the $55 level. The weekly candle looks a bit
WTI Crude Oil
The WTI Crude Oil market initially tried to rally during the week but continues to struggle at the $55 level. The weekly candle looks a bit resistive, but quite frankly I feel that we’re going to continue to consolidate. The alternate scenario of course is if we can break above the $55 level, the market should then continue to go higher, perhaps reaching towards the $60 handle. Alternately though, I believe that it’s more likely that we will be in a situation that almost impossible to trade from the longer-term charts, so it’s probably best to look at the daily timeframe and lower. I feel that the market is at a serious point of inflection, so will be interesting to see what happens next in this market. You can see that I have the consolidation area marked clearly by a turquoise box on the chart.
Crude Oil Inventories Video 22.2.17
Watch our Crude Oil Video Forecast:
Brent
Brent markets are doing much the same thing, but to be honest they look a little softer than the WTI market. The $55 level underneath it looks to be supportive, and I believe that the support extends all the way down to the $53.50 level. If we broke above the $58 level, the market should then reach towards the $60 level. I think that this is a choppy market just waiting to happen so it’s probably better to trade off short-term charts as well. I have no interest in trying to trade this market from the longer-term, and I believe that scalping and options will probably be the best way to play this market.
Recently, the British investment bank and of Berkeley suggested that the brand market could be as high as $77 at the end of 2018, but have just cut that estimate by $10. I think this shows that we are starting to see a little bit of acknowledgment that the markets are flooded with the commodity. Because of this, I think that we are starting to see the beginning of the move lower that I think will be coming later.
About the Author
Christopher Lewisauthor
Chris is a proprietary trader with more than 20 years of experience across various markets, including currencies, indices and commodities. As a senior analyst at FXEmpire since the website’s early days, he offers readers advanced market perspectives to navigate today’s financial landscape with confidence.


Advertisement