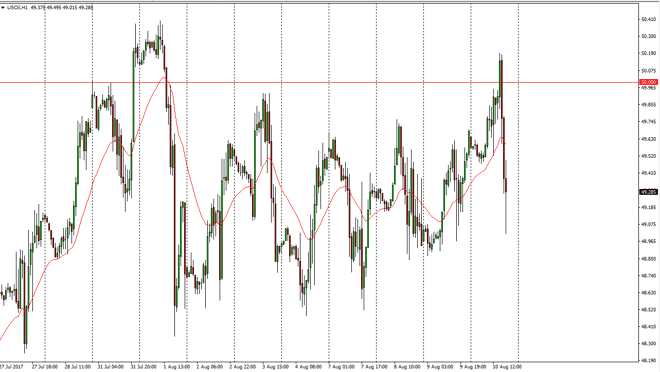
WTI Crude Oil The WTI Crude Oil market rallied initially during the day on Thursday but was repulsed at the $50 level. Ultimately, the market looks as if
The WTI Crude Oil market rallied initially during the day on Thursday but was repulsed at the $50 level. Ultimately, the market looks as if it is going to continue to struggle at that level, as it is a major round number. I believe that until we can break above the $50.50 level, the market looks likely to face massive selling pressures. Ultimately, I think that volatility continues to be a major issue, and because of this I believe that the choppiness will continue. If we do break above the $50.50 level, I think that the market will go looking towards the $52 level as well. Alternately, if we can find resistance near the $50 level, I’m a seller again as we continue to see the bearish pressure come back into the marketplace.
Brent markets broke higher initially during the day on Thursday, but found enough resistance at the $53 level to go slamming back into the $52.50 level for support. Ultimately, this is a classic “break out and then retest” situation. I believe that we will probably bounce from here, but if we break down below the $52 level, the market will then continue to roll over. I think we continue to see a significant amount of exhaustion and volatility from time to time, but ultimately it looks as if the Brent markets are going to try to grind higher. The $55 level above is massively resistive, but it could be the target that longer-term traders are aiming towards. This being the case, the market looks likely to be very choppy and difficult to trade over the next several sessions. Unless you can handle the volatility or have the ability to trade small positions, this might not be the market for you.
Chris is a proprietary trader with more than 20 years of experience across various markets, including currencies, indices and commodities. As a senior analyst at FXEmpire since the website’s early days, he offers readers advanced market perspectives to navigate today’s financial landscape with confidence.