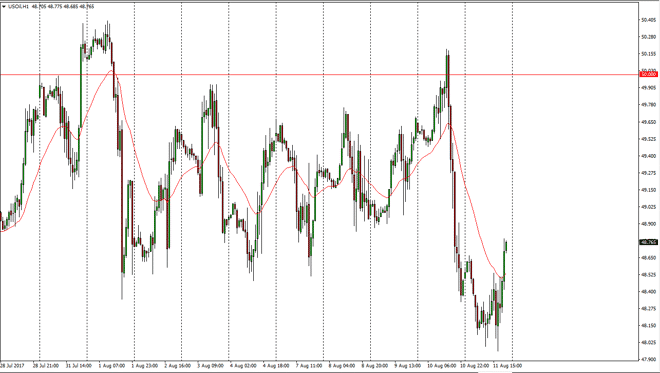
WTI Crude Oil The WTI Crude Oil market initially fell during the session on Friday, but found enough support near the $48 level to turn around to form a
The WTI Crude Oil market initially fell during the session on Friday, but found enough support near the $48 level to turn around to form a very bullish move. The hammer that formed during the day of course is a bullish sign and I think that we are trying to reach towards the top of the recent consolidation area, which could have the market going towards the $50 handle. I have no interest in shorting, unless of course we can make a fresh, new low, which would send this market much lower. Ultimately, this is a market that continues to be volatile, and I do think that the oil markets will eventually break down but currently it looks like there is still a lot of back and forth type of trading. If we were to break above the $50.50 level, the market could go much higher as it would be a very bullish sign.
Brent markets initially fell, but then bounced from the $51.25 level to form a bullish candle. That being the case, I think that the market is going to go looking towards the $52.50 level, where will face a significant amount of resistance. A break above there could send this market looking towards the $53.50 level next. Pay attention to the US dollar, because it of course has an effect on this market also. If the US dollar starts to strengthen, that puts bearish pressure on this market also. There is still a lot of noise out there when it comes to oil markets, and of course production cuts, so having said that it’s likely that we will continue to see a lot of volatility in this market over the next several sessions. If we break to a fresh, new low, I think that were going to go looking towards the $50 handle underneath.
Chris is a proprietary trader with more than 20 years of experience across various markets, including currencies, indices and commodities. As a senior analyst at FXEmpire since the website’s early days, he offers readers advanced market perspectives to navigate today’s financial landscape with confidence.