WTI Crude Oil The WTI Crude Oil market was initially somewhat sideways during the day on Monday but then turned around to sell off drastically during
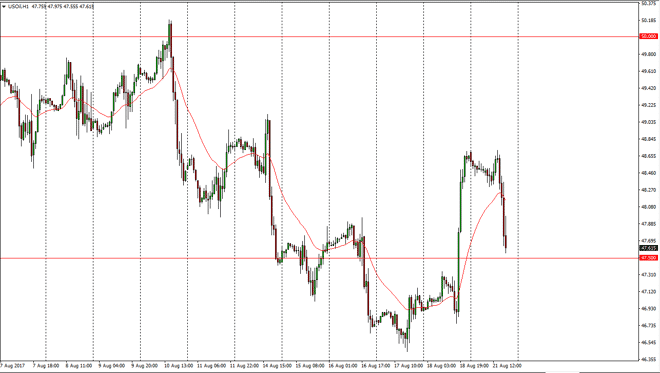
The WTI Crude Oil market was initially somewhat sideways during the day on Monday but then turned around to sell off drastically during American trading. We reached towards the $47.50 level, and therefore an area that should be supportive. If we can break down below that level, the market is very likely to see quite a bit of support extending down to the $46.50 level. If we can bounce from here, I think that the market goes looking towards the $48.50 level above. The oil markets continue to be very volatile, but when you look at the longer-term charts it seems that the markets are drifting lower overall. There is an obvious concern about oversupply, so having said that it will more than likely continue to weigh upon the value of crude oil in general. Also, pay attention to the US Dollar Index, as the value of the currency also influences price.
Brent markets initially were sideways during the day on Monday, but the $52.50 support level has given way, and we have fallen a full dollar since then. Because of this, I think that the markets can go looking for more serious support at the $51 level, and then possibly even the $50 level. Crude oil looks horrible as every rally that we get, the sellers come in and smash it right away. If we can find support, it’s possible that we go back towards the $52.50 level, but there isn’t much on this chart that gives me a lot of hope for any sustained rally. If we break down below the $50 level, that would of course be very bearish, and send this market towards the $48 level underneath. I expect that thin volume during vacation season will continue to be an issue as well.
Chris is a proprietary trader with more than 20 years of experience across various markets, including currencies, indices and commodities. As a senior analyst at FXEmpire since the website’s early days, he offers readers advanced market perspectives to navigate today’s financial landscape with confidence.