
Advertisement
Advertisement
Crude Oil Price Forecast November 15, 2017, Technical Analysis
Updated: Nov 15, 2017, 05:32 GMT+00:00
WTI Crude Oil The WTI Crude Oil market drifted a little bit lower during the trading session on Tuesday, and then fell hard. The $55 level underneath has
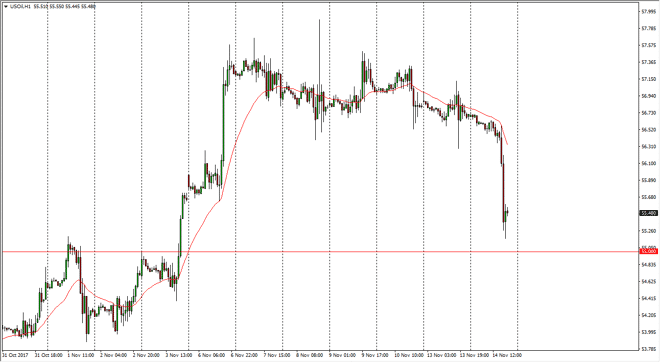
WTI Crude Oil
The WTI Crude Oil market drifted a little bit lower during the trading session on Tuesday, and then fell hard. The $55 level underneath has offered a bit of support, and we had formed a hammer on the hourly chart. This is an area that has been resistive in the past and its of course a large, round, psychologically significant number. A bounce from here could send this market towards the $56.75 level. The market should continue to be very volatile, as we get the Crude Oil Inventories announcement coming out today, and that of course will have a massive effect on what happens next. A breakdown below the $55 level could send the market looking for the $54 level, however a bounce here should send this market looking for $57.50 in the short term.
Oil Forecast Video 15.11.17
Brent
Brent markets also fell significantly during the day, reaching down towards the $61.25 level. There is even more support at the $60 level, so if we do fall from here, I think that there is going to be plenty of buyers in that area. Alternately, if we rally from here I expect the $64 level to be strong resistance, followed by even more stringent resistance at the $65 handle. Overall, the market continues to be noisy, and of course a lot of attention will be paid to what’s going on with the Saudi and Iranian governments, and of course an increase in tension. Beyond that, there is a lot of concerns when it comes to the oversupply potential as higher prices will bring American, Canadian, and Mexican drillers back into the fray handover for this. Because of this, I believe that oil is going to continue to be extraordinarily volatile. The US dollar course offers a lot of influence as well.
About the Author
Christopher Lewisauthor
Chris is a proprietary trader with more than 20 years of experience across various markets, including currencies, indices and commodities. As a senior analyst at FXEmpire since the website’s early days, he offers readers advanced market perspectives to navigate today’s financial landscape with confidence.


Advertisement