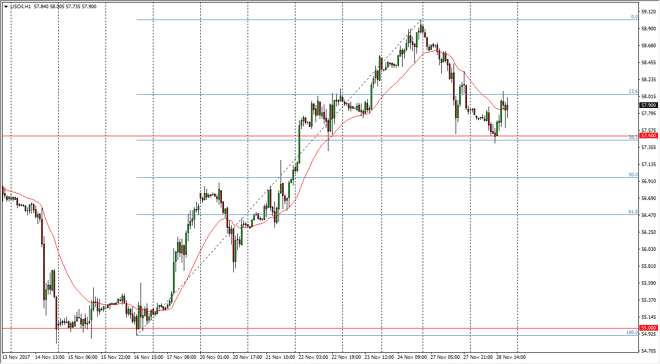
WTI Crude Oil The WTI Crude Oil market initially drifted lower during the trading session on Tuesday, testing the $57.50 level for support, and finding
The WTI Crude Oil market initially drifted lower during the trading session on Tuesday, testing the $57.50 level for support, and finding it. It is also the 38.2% Fibonacci retracement level, an area that of course attract a lot of attention, and has been support in the past. I think given enough time, the market will try to break out to the upside, clearing the $58 level and try to go towards the $59 level after that. Longer-term, I anticipate that the $60 level will be targeted as it is a large target. Ultimately, even if we do break down from here, I suspect that the $57 level will also offer a certain amount of support and a significant buying opportunity as well.
Brent markets continue to chop around, with the $63 level offering support, and the $64 level above offering resistance. If we can break above the $64 level, the market then goes to the $65 level after that. Alternately, a breakdown below the $63 level should send this market down to the $62 level next. Crude oil markets continue to be very noisy, and with today being the crude oil inventory announcement, it’s likely that we will get a certain amount of volatility. Longer-term, I believe that the $65 level above should be the overall target as it is such a large number. Regardless, expect that there is a lot of buying opportunities going forward, unless of course the inventory number comes out extraordinarily bearish. I believe that any type of knee-jerk reaction is probably a nice opportunity to the upside if the number shocks. In general, I believe in buying but I also recognize that today could be very noisy. Also, you should keep an eye on the US dollar, as this market tends to have an inverse correlation.
Chris is a proprietary trader with more than 20 years of experience across various markets, including currencies, indices and commodities. As a senior analyst at FXEmpire since the website’s early days, he offers readers advanced market perspectives to navigate today’s financial landscape with confidence.