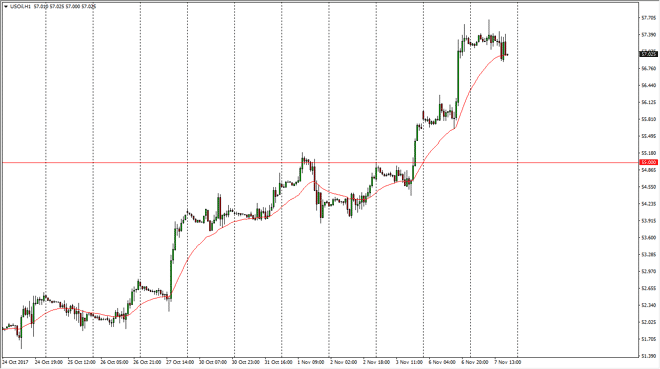
WTI Crude Oil The WTI Crude Oil market went sideways during the trading session on Tuesday, covering the $57 level. Ultimately, the market looks likely to
The WTI Crude Oil market went sideways during the trading session on Tuesday, covering the $57 level. Ultimately, the market looks likely to pull back from here, as it does look like we are drifting a little bit lower towards the end of the session. I think that a pullback is probably going to be a buying opportunity although OPEC did suggest during the day that perhaps demand was going to slow down as non-OPEC countries continue to produce crude oil going forward. I think the $55 level underneath will be massively supportive, and that should be the bottom of the short-term uptrend. If we are to break down below the $55 level, I think at that point we have a more significant turnaround. Currently, I believe that the market is trying to get to the $60 handle above which should be psychological resistance.
Brent markets rolled over a bit during the day, breaking towards the 24-hour exponential moving average. We are also sitting just above the $63.50 level, which looks to offer support. I believe that the market should then go to the $65 level above, as this very technical oil market will continue to be paying attention to the larger numbers such as the $65 handle. I believe that the market will more than likely continue to the upside, and the buying on the dips will be the best way to approach this market, although perhaps in small increments as the volatility tends to be very difficult. Overall, if we were to break above the $65 handle, that would be an extraordinarily bullish sign. However, I think that once we get a little bit higher from here, increase production coming out of the United States and Mexico will probably put a damper on the rally.
Chris is a proprietary trader with more than 20 years of experience across various markets, including currencies, indices and commodities. As a senior analyst at FXEmpire since the website’s early days, he offers readers advanced market perspectives to navigate today’s financial landscape with confidence.