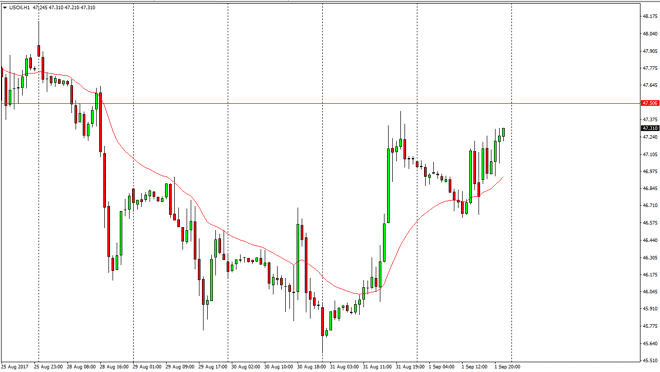
WTI Crude Oil The WTI Crude Oil market initially fell on Friday, but found enough support near the $46.50 level to turn around and rally. A line of what
The WTI Crude Oil market initially fell on Friday, but found enough support near the $46.50 level to turn around and rally. A line of what we are seeing is a reaction to hurricane Harvey, and potential disruptions. Ultimately, if we can break above the $47.50 level, the market should go higher. Longer-term, I think that the market should sell off again, but at this point it’s only a matter of time before you go higher. Short-term momentum continues to jump to the upside.
Brent markets continue to find plenty of support, especially near the $52.25 level. I believe that the market is ready to go higher, and when I look at the weekly charts of both of these markets, they are forming hammers. This is a sign that oil is starting to turn around again, but given enough time I expect the sellers return as we have seen time and time again.
Chris is a proprietary trader with more than 20 years of experience across various markets, including currencies, indices and commodities. As a senior analyst at FXEmpire since the website’s early days, he offers readers advanced market perspectives to navigate today’s financial landscape with confidence.