Advertisement
Advertisement
Crude Oil Price forecast for the week of November 20, 2017, Technical Analysis
Updated: Nov 18, 2017, 12:32 GMT+00:00
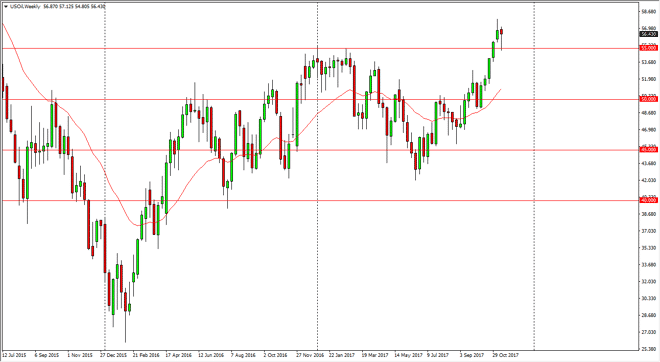
WTI Crude Oil The WTI Crude Oil market fell during most of the week, but turned around at the $55 level, showing signs of support and end up forming a
WTI Crude Oil
The WTI Crude Oil market fell during most of the week, but turned around at the $55 level, showing signs of support and end up forming a hammer. The hammer of course is a bullish sign, and I recognize that the market breaking out above the $55 level previously was a very bullish sign. I believe that the market should continue to go higher in the short term, as the $60 level will almost certainly be targeted now. There will be a lot of volatile action, but a breakdown below the $55 level could send this market much lower. Given enough time, I think the sellers will return, but it’s obvious that the buyers are starting to have their way with this market, thereby offering buying opportunities. If we were to sell off here though, we could find a sudden drop to the $50 handle happening.
WTI Video 20.11.17
Brent
Brent markets fell significantly during the week as well, but found enough support above the $60 level. The hammer of course is a bullish sign, and should continue to signify that the market will go higher, perhaps reaching towards the $65 level next. A breakdown below the $60 level sends this market to the $55 handle next, and it’s likely that we will continue to see buyers picking up dips going forward. The move is a little bit overextended, and that of course brings a bit of concern, but it’s obvious that the buyers have control of the market, so therefore shorting is going to be all but impossible until we get a sign to go short, below the $60 handle. I think that the $65 level could cause enough exhaustion to turn things around, but selling until we get a breakdown is almost impossible.
About the Author
Christopher Lewisauthor
Chris is a proprietary trader with more than 20 years of experience across various markets, including currencies, indices and commodities. As a senior analyst at FXEmpire since the website’s early days, he offers readers advanced market perspectives to navigate today’s financial landscape with confidence.
Advertisement
