
Advertisement
Advertisement
Dow Jones 30 and NASDAQ 100 Forecast March 23, 2017, Technical Analysis
Updated: Mar 23, 2017, 05:54 GMT+00:00
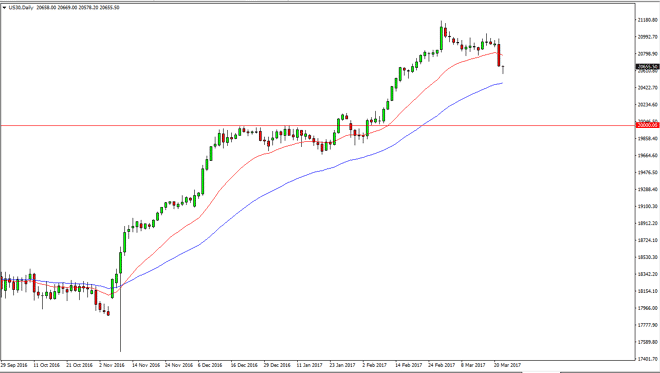
Dow Jones 30 The Dow Jones 30 initially fell during the session on Wednesday, but found enough of bullish pressure underneath to turn things around and
Dow Jones 30
The Dow Jones 30 initially fell during the session on Wednesday, but found enough of bullish pressure underneath to turn things around and form a supportive looking candle. If we can break above the top of the candle for the day, it’s likely that we will go looking for the 21,000 handle. We have been in a longer-term uptrend for some time, so this pullback should offer value for plenty of traders out there.
Dow Jones 30 and NASDAQ Index Video 23.3.17
NASDAQ 100
The NASDAQ 100 initially fell as well, but found quite a bit of bullish pressure as it started to turn things around and reach towards the 5440 handle. A break above that should send this market towards the 5500 level. I have no interest in shorting this market, and I think the dips like we have seen over the last couple of sessions offer value that people will take advantage of.
About the Author
Christopher Lewisauthor
Chris is a proprietary trader with more than 20 years of experience across various markets, including currencies, indices and commodities. As a senior analyst at FXEmpire since the website’s early days, he offers readers advanced market perspectives to navigate today’s financial landscape with confidence.


Advertisement