
Advertisement
Advertisement
Dow Jones 30 and NASDAQ 100 Index Price Forecast May 25, 2017, Technical Analysis
Updated: May 25, 2017, 03:49 GMT+00:00
Dow Jones 30 The Dow Jones 30 initially dipped just a little bit lower at the open on Wednesday, but we continue to see sideways action as the markets are
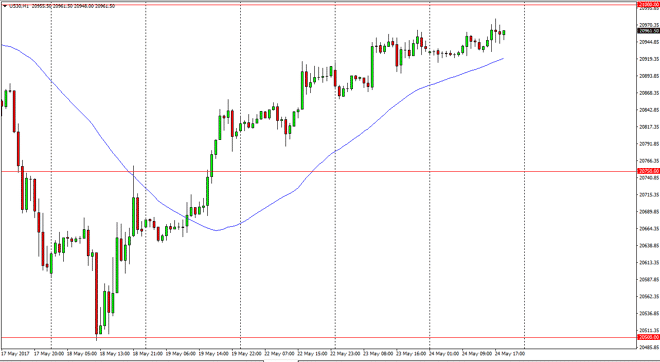
Dow Jones 30
The Dow Jones 30 initially dipped just a little bit lower at the open on Wednesday, but we continue to see sideways action as the markets are consolidating after a nice move higher. If we can break above the 21,000 level, I feel that the market will continue to go higher. I also believe that pullbacks offer buying opportunities, and will be seen as value. Ultimately, I think that the market will attract money going forward as the US stock markets have lead the way for the rest of the world. A break above the 21,000 level should send this market to the 21,500 level next. I have no interest in selling, and believe that value hunters are out there waiting to pick up the pieces every time we fall.
Dow Jones 30 and NASDAQ Index Video 25.5.17
NASDAQ 100
The NASDAQ 100 went sideways initially during the day on Wednesday, as the 5700 level continues to offer support. We rallied as high as the 5720 handle, and then turned around to test the 24 hour moving average below. I believe that the 5700 level will continue to offer support, and it’s only a matter of time before we go looking for the 5750 handle, which of course is a nice short-term target based upon the large round number. The market has been leading the other indices around the world higher, and I think that is going to continue to be the case.
The 72 hour moving average below, colored in blue, should continue to offer longer-term support as well, so therefore I don’t see any way to sell this market. Even if we did breakdown, I think there should be plenty of value hunters out there willing to take advantage of this market as it is so bullish longer term.
About the Author
Christopher Lewisauthor
Chris is a proprietary trader with more than 20 years of experience across various markets, including currencies, indices and commodities. As a senior analyst at FXEmpire since the website’s early days, he offers readers advanced market perspectives to navigate today’s financial landscape with confidence.


Advertisement