
Advertisement
Advertisement
Dow Jones 30 and NASDAQ 100 Price Forecast June 21, 2017, Technical Analysis
Updated: Jun 21, 2017, 04:40 GMT+00:00
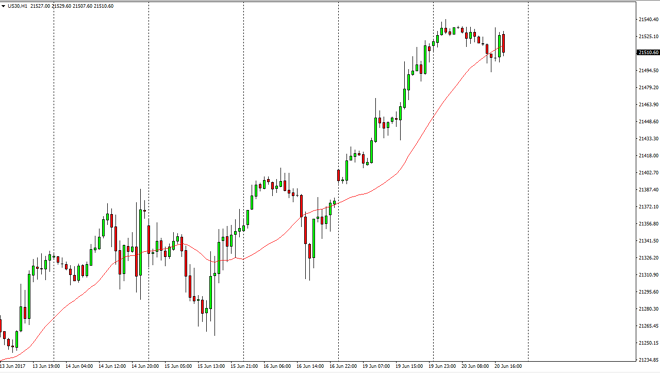
Dow Jones 30 The Dow Jones 30 had a volatile session on Tuesday, as we dropped down to the 21,500 level. However, the market bounced enough to show signs
Dow Jones 30
The Dow Jones 30 had a volatile session on Tuesday, as we dropped down to the 21,500 level. However, the market bounced enough to show signs of life still, so I don’t have any interest in shorting. I believe that given enough time, the market will break out to the upside, especially near the 22,000 handle. I think that given enough time it’s not likely going to be a market that’s easy to deal with, but I believe that the volatility should work in your favor as it offers value from time to time. The Dow Jones 30 is considered to be the blue-chip stock index, and that of course benefits due to the recent roll over and of course sector rotation out of technology.
Dow Jones 30 and NASDAQ Index Video 21.6.17
NASDAQ 100
The NASDAQ 100 initially fell during the session on Tuesday, but continues to find buyers on dips. Given enough time, we are going to break out and above the top of a massive W pattern, and that should give us an opportunity to go long. Remove above the 5780 level triggers that, and I’m a buyer above there. I also believe in buy-in supportive candle split especially near the 5700 level. US stock indices in general all look very healthy, and I don’t have any interest in trying to fight the recent momentum to the upside. I think that given enough time, we will reach the 6000 handle, but it’s going to take quite a bit of fight and momentum to reach to that level. Keep in mind that the recent selloff has been more about a handful of companies than overall weakness. It also appears that we are starting to see those large tech companies attract money as well, and that should continue to support the NASDAQ 100.
About the Author
Christopher Lewisauthor
Chris is a proprietary trader with more than 20 years of experience across various markets, including currencies, indices and commodities. As a senior analyst at FXEmpire since the website’s early days, he offers readers advanced market perspectives to navigate today’s financial landscape with confidence.


Advertisement