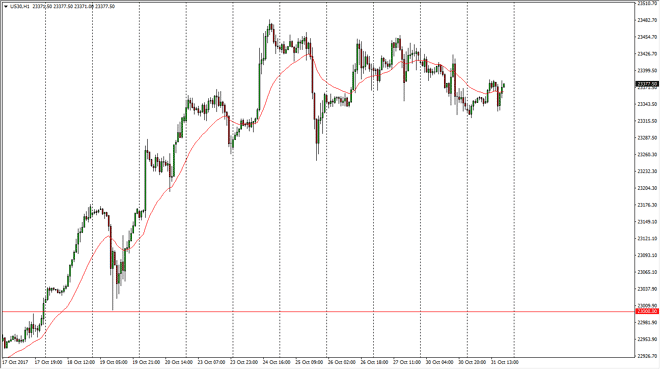
Dow Jones 30 The Dow Jones 30 went sideways overall but showed signs of positivity during the day on Tuesday as the 23,350 level looks to be supportive. I
The Dow Jones 30 went sideways overall but showed signs of positivity during the day on Tuesday as the 23,350 level looks to be supportive. I believe that the market will eventually go looking towards the highs again, near the 23,500 level. A break above there census market much higher, perhaps reaching towards the 24,000 longer term. I think the pullbacks continue to offer value in a market that continues to show signs of bullish pressure over the longer term, and you can even make an argument for an ascending triangle on the hourly chart. I’m a buyer of dips, and I recognize that the Dow Jones 30 is one of the bigger movers recently. I believe that the market should continue to be very noisy, but I have no interest in shorting as I believe the 23,000 level underneath is the floor.
The NASDAQ 100 rally during the day on Tuesday, reaching towards the 6250 level above, which has been resistance during the previous session. I believe the pullbacks should be buying opportunities, and I also recognize that the 6200 level underneath is massive support. If we can continue to go higher, the 6200 level should then become the bottom of the uptrend. However, if we were to break down below the 6200 level, then I think the market will probably go down to the 6100 level after that. Overall, this is a market that continues to be very strong, and I believe that we will continue to find buyers on these dips. The market is probably going to target the 6300 level above. Overall, the volatility continues to be a major factor, but it is exactly what will give you the ability to add to a position later.
Chris is a proprietary trader with more than 20 years of experience across various markets, including currencies, indices and commodities. As a senior analyst at FXEmpire since the website’s early days, he offers readers advanced market perspectives to navigate today’s financial landscape with confidence.