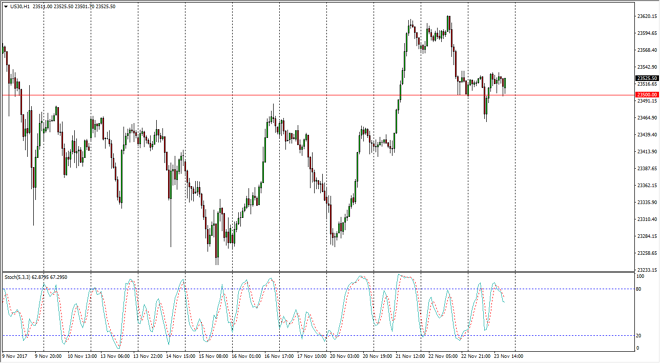
Dow Jones 30 The Dow Jones 30 CFD went sideways during most of the session, dipping below the 23,500 level momentarily, before popping back above that
The Dow Jones 30 CFD went sideways during most of the session, dipping below the 23,500 level momentarily, before popping back above that level to enter the same region. I think that the market of course having no underlying contract to trade off of leaves it more or less hands-off. I think that the 23,500 level should continue to offer support though, and that with the limited electronic trading that the underlying instrument has today, we could see a bit more buying pressure. However, the this is a market that certainly looks a bit overextended in the short term. I believe that buying in small amounts is probably the best way to go, as although it is most certainly bullish, we have not had a significant pullback in quite a while.
The NASDAQ 100 went sideways during the day as one would expect, as the underlying instrument wasn’t online. I think that buying dips makes a lot of sense, and I think that the 6400 level above should offer quite a bit of resistance. If we can break above there, the market should then go to the 6500 level after that. In general, the volatility offers opportunities as the market has a strong upward bias. Once we break above the 6400 level, I would anticipate that the momentum would pick up. In the meantime, I like looking at pullbacks to the 6300 level as opportunities. I have no interest in shorting the NASDAQ 100, it is far too strong to consider doing so, and it would certainly be a very difficult way to trade. By being patient, and waiting for buying opportunities at lower levels, you should be able to build a large position to ride out the bullish pressure.
Chris is a proprietary trader with more than 20 years of experience across various markets, including currencies, indices and commodities. As a senior analyst at FXEmpire since the website’s early days, he offers readers advanced market perspectives to navigate today’s financial landscape with confidence.