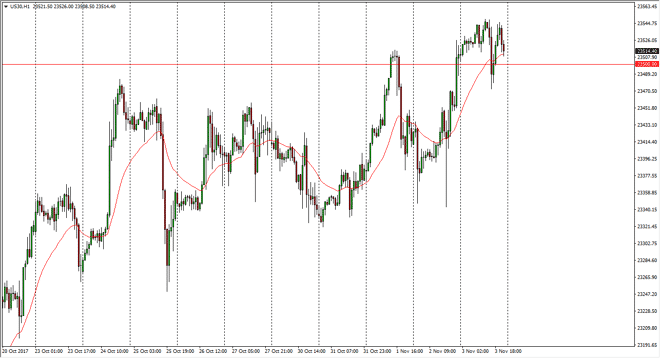
Dow Jones 30 The Dow Jones 30 went back and forth during the session on Friday, bouncing around the 23,500 level. This is an area that has previously been
The Dow Jones 30 went back and forth during the session on Friday, bouncing around the 23,500 level. This is an area that has previously been resistive, but it is now supported. I think that the market could rally from here if we can build up enough momentum to continue the uptrend. I don’t have any interest in shorting this market, I think there’s plenty of buying underneath that could lift the Dow Jones 30, reaching towards the 24,000 level. Longer-term, the market goes higher from what I can see, but pullbacks will probably offer buying opportunities. The market should continue to go much higher overall, especially with the earnings season being better than anticipated on several fronts. If the US dollar continues to rally, that could be a catalyst to pull back as well.
The NASDAQ 100 went sideways initially during the trading session on Friday but found enough support at the 24-hour exponential moving average to turn things around and send the NASDAQ 100 to fresh, new highs. Now that we have decidedly broken out to the upside, I think that short-term pullbacks continue to be buying opportunities. The 6200-level underneath should offer support going forward, and essentially a “floor” in the market. I think that buying on the dips continues to be the best way forward, but if we were to break down below the 6200 level, the market will probably go looking towards the 6000 level below which was the recent ceiling that we broke out of. Overall though, I think that pullbacks are buying opportunities, and I think that you should look at the market as an opportunity to pick up value over the next several sessions.
Chris is a proprietary trader with more than 20 years of experience across various markets, including currencies, indices and commodities. As a senior analyst at FXEmpire since the website’s early days, he offers readers advanced market perspectives to navigate today’s financial landscape with confidence.