
Advertisement
Advertisement
Dow Jones 30 and NASDAQ 100 Price Forecast October 12, 2017, Technical Analysis
Updated: Oct 12, 2017, 04:56 GMT+00:00
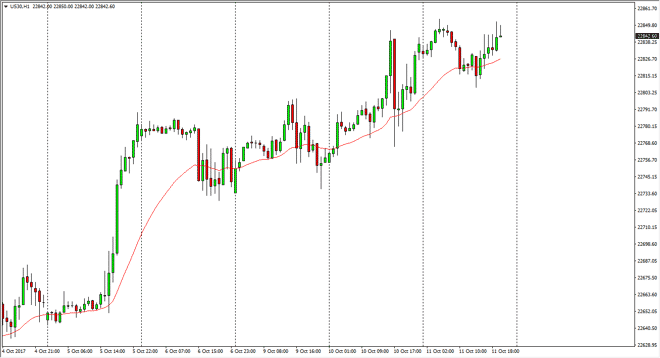
Dow Jones 30 The Dow Jones 30 initially rally during the day on Wednesday, but then rolled over to test the 24-hour exponential moving average for
Dow Jones 30
The Dow Jones 30 initially rally during the day on Wednesday, but then rolled over to test the 24-hour exponential moving average for support. We bounce from there, looking towards the highs again. I think that the market will eventually go looking towards the 23,000 level, so I like buying pullbacks as they represent value in a market that has clearly been very bullish for some time. Ultimately, I think that we will not only reach towards the 23,000 level, but we will break significantly above it. Once we do, then the market will have the proclivity to go to the 23,500 level. Although the market has been bullish for what seems like forever, there’s no reason to think that were going to roll over for any significant amount of time. With earnings season coming, it’s likely that we should have plenty of good news coming out of major industrials, and I think we continue to see buyers jumping in and buying.
Dow Jones 30 and NASDAQ Index Video 12.10.17
NASDAQ 100
The NASDAQ 100 initially fell as well, testing the 6050 handle for support, rallying towards the 6070 handle. If we can clear that area, then the market will probably go looking towards the 6100-level next, and then eventually the 6200 level after that. Ultimately, when you look at the longer-term charts, the breakout above the 6000 handle was a clearance of an ascending triangle that measures for a move towards the 6200 level, and I think it’s only a matter of time before we continue to see people looking at the NASDAQ 100 as value. Ultimately, I have no interest in shorting this market, least not until we were to break down below the 6000 level for a longer-term close, perhaps on a daily chart, or even the weekly chart.
About the Author
Christopher Lewisauthor
Chris is a proprietary trader with more than 20 years of experience across various markets, including currencies, indices and commodities. As a senior analyst at FXEmpire since the website’s early days, he offers readers advanced market perspectives to navigate today’s financial landscape with confidence.


Advertisement