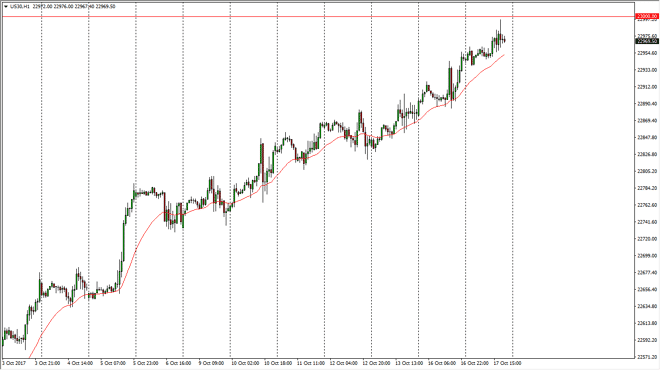
Dow Jones 30 The Dow Jones 30 when hired during the session on Tuesday, reaching towards the 23,000 level above. That’s an area where we have seen a bit
The Dow Jones 30 when hired during the session on Tuesday, reaching towards the 23,000 level above. That’s an area where we have seen a bit of resistance, as it is a large, round, psychologically significant number. The market looks likely to pull back from here, but I think that it’s only a matter of time before the buyers come back and push this market above that level. Once we clear the 23,000 level, the market should continue to go even higher. The 24-hour exponential moving average has been very reliable as dynamic support, and I think that it’s only a matter of time before we find a reason to go higher. Earnings season, of course, continues to do quite well, and that should eventually have traders jumping into the marketplace yet again as the upward momentum continues.
The NASDAQ 100 drifted slightly lower during the day on Tuesday, but as you can see there is a significant uptrend line on the hourly chart, that has offered support. I think that we will continue to go higher, but it’s a market also that is going to continue to be choppy. The NASDAQ 100 continues to lead the overall stock market higher, but if we were to break down below the uptrend line, we could drop towards the 6050 level below which should be massively supportive. If we break down below there, the market and goes to the 6000 handle in my estimation. Longer-term though, we had the market break above the 6000 level and slice above the top of the ascending triangle that measured for moved to the 6200 level. I still think we’re going there, so I like buying dips regardless.
Chris is a proprietary trader with more than 20 years of experience across various markets, including currencies, indices and commodities. As a senior analyst at FXEmpire since the website’s early days, he offers readers advanced market perspectives to navigate today’s financial landscape with confidence.