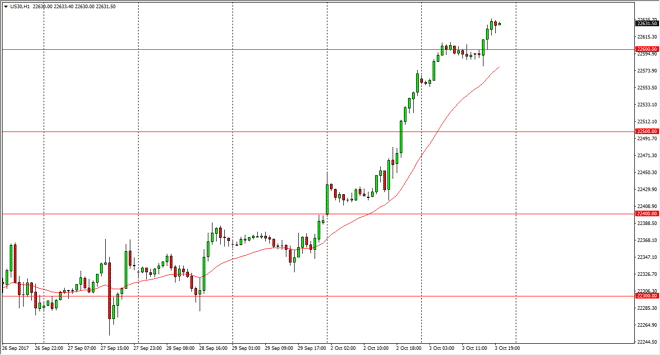
Dow Jones 30 The Dow Jones 30 initially rose during the day on Tuesday, then went sideways at the 22,600 level. We then rallied again as the Americans
The Dow Jones 30 initially rose during the day on Tuesday, then went sideways at the 22,600 level. We then rallied again as the Americans came on board, pushing the market to fresh, new highs. I believe that the Dow Jones 30 continues to show signs of resilience, and of course, the overall trend is strong. The sector rotation out of technology and into industrials, of course, has helped the Dow Jones 30 as well, so I think we continue to see buyers. I like buying dips in a market that looks set to go towards the 22,700-level next. Longer-term, I believe we go to the 23,000 level but it may take a significant amount of time to get there as we are starting to get a little bit overextended. I remain bullish, but recognize that you can’t go “all in.”
The NASDAQ 100 was slightly positive during the session on Tuesday again, as we tested the 6000 handle. That level has held again though, and because of that, I think the upward pressure is mounting but has not been able to take over yet. I think that a break above the 6000 level is the signal that buyers will need to feel confident, but you can see clearly on the hourly chart that the 24-hour exponential moving average is offering dynamic support. I believe in buying dips, I don’t have any interest in shorting because although we continue to run into trouble just above, the lows are getting higher, the very essence of an uptrend and a potential breakout. Once we do get a breakout, I think we go looking towards the 6200-level based upon the larger ascending triangle that has been forming.
Chris is a proprietary trader with more than 20 years of experience across various markets, including currencies, indices and commodities. As a senior analyst at FXEmpire since the website’s early days, he offers readers advanced market perspectives to navigate today’s financial landscape with confidence.