Dow Jones 30 The Dow Jones 30 went sideways initially during the day on Friday but then fell after the jobs number was a bit disappointing. However, the
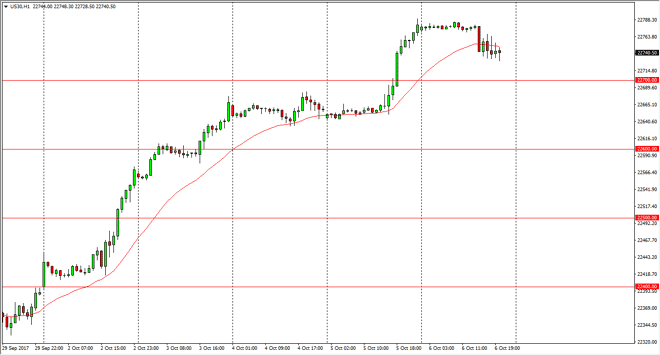
The Dow Jones 30 went sideways initially during the day on Friday but then fell after the jobs number was a bit disappointing. However, the market has plenty of support just below at the 22,700 level, and I think that the market will eventually find buyers to the upside. I think that even if we pull back from here, I think there is plenty of support below, extending down to at least the 22,500 level. Given enough time, I think that the market should continue to see the uptrend reached towards the 23,000 level. Ultimately, this is a market that should continue to enjoy the sector rotation out of technology and into industrials going forward. Longer-term, I think that this makes an excellent buy-and-hold scenario as well.
The NASDAQ 100 initially went sideways but fell after the jobs number came out. Having said that, we bounced from there, and it looks likely to continue going higher based upon the significant bounce. If we can make a fresh, new high, and it looks as if we will, I think that the market is probably going to go towards the 6100 level, and then possibly the 6200 level after that. The breakout above the 6000 level was vital, and of course very profound. I think that’s going to bring in fresh money, and now that the jobs number is all the way, and of course must be bored looking at it as an anomaly due to the pair of hurricanes, I think that the market continues to find value on dips, and of course plenty of interest quite forward. I believe that the “floor” is at the 6000 handle, offering a nice measuring stick as to what’s going on with the trend.
Chris is a proprietary trader with more than 20 years of experience across various markets, including currencies, indices and commodities. As a senior analyst at FXEmpire since the website’s early days, he offers readers advanced market perspectives to navigate today’s financial landscape with confidence.