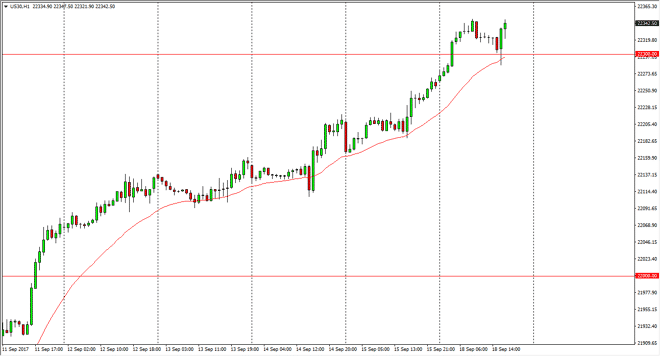
Dow Jones 30 The Dow Jones 30 went sideways in general, but then found plenty of buying pressure near the 22,300 level on Monday to continue rallying. I
The Dow Jones 30 went sideways in general, but then found plenty of buying pressure near the 22,300 level on Monday to continue rallying. I believe that this market will continue to find buyers overall, and that we will eventually reach towards the 22,500 level. Because of the signs of strength, I think that we are going to continue to grind higher, I don’t think that we are going to explode though. Certainly, the positivity of the market seems to be continuing, so bullish pressure is expected.
The NASDAQ 100 has broken out to fresh, new highs during the session on Monday, as the 6000 level should now offer support. Because of this, I am a buyer and I believe that we will eventually reach towards the 6050 level over the next several sessions, if not weeks. I believe in buying dips on short-term charts should continue to be a good way to go forward.
Chris is a proprietary trader with more than 20 years of experience across various markets, including currencies, indices and commodities. As a senior analyst at FXEmpire since the website’s early days, he offers readers advanced market perspectives to navigate today’s financial landscape with confidence.