
Advertisement
Advertisement
E-mini Dow Jones Industrial Average (YM) Futures Analysis – October 2, 2014 Forecast
By:
December E-mini Dow Jones Industrial Average futures broke sharply on Wednesday, hitting a major uptrending angle and a 50% retracement level. The close
December E-mini Dow Jones Industrial Average futures broke sharply on Wednesday, hitting a major uptrending angle and a 50% retracement level. The close near the low suggests there is enough downside momentum to continue the move, however, if there is no follow-through to the downside, traders have to be prepared for profit-taking or aggressive counter-trend buying.
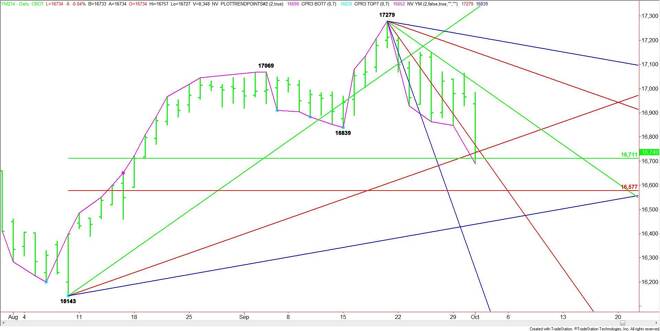
The main trend turned down on the daily chart when 16839 was taken out. The new main top is 17279.
The main range is 16143 to 17279. The retracement zone created by this range at 16711 to 16577 was the primary downside target. The upper or 50% level of this range at 16711 was tested today. The test did produce a slight technical bounce, suggesting profit-taking. Continue to watch this price level today to see if the sellers or the buyers are piling up to move the market.
In addition to the 50% level, the market also tested a major uptrending angle at 16751. Holding above this level will indicate the buying is getting stronger.
If 16711 fails to hold as support then look for more selling pressure to drive the market into the Fibonacci level at 16577. If this level fails then look for the break to extend into the next uptrending angle at 16447.
A key downtrending angle to watch is 16703. Crossing to the bearish side of this angle will be a sign of weakness, but crossing to the strong side of the uptrending angle at 16751 will be a sign of strength. If buyers can sustain a move above this angle then the daily chart indicates it could retrace all the way back to 16991.
Read the order flow closely between 16703 and 16751. The market could spend most of the session between these two numbers as the buyers and sellers try to determine who has the upper hand. A sustained move under 16703 will be bearish. Trading above 16751 on increasing volume will be bullish.
About the Author
James Hyerczykauthor
James Hyerczyk is a U.S. based seasoned technical analyst and educator with over 40 years of experience in market analysis and trading, specializing in chart patterns and price movement. He is the author of two books on technical analysis and has a background in both futures and stock markets.


Advertisement