
Advertisement
Advertisement
E-mini Dow Jones Industrial Average (YM) Futures Technical Analysis – Inside 25775 to 24820 RT Zone
By:
Based on last week’s price action and the close at 25364, the direction of the March E-mini Dow Jones Industrial Average this week is likely to be determined by trader reaction to the 50% level at 25775 and the Fibonacci level at 24820.
March E-mini Dow Jones Industrial Average futures closed sharply lower last week The benchmark S&P 500 Index, the blue chip Dow Jones Industrial Average and the technology driven NASDAQ Composite all fell more than 10% last week. They also entered correction territory, down more than 10% from all-time highs notched earlier in February.
Last week, March E-mini Dow Jones Industrial Average futures settled at 25364, down 3617.00 or -14.26%.
Weekly Technical Analysis
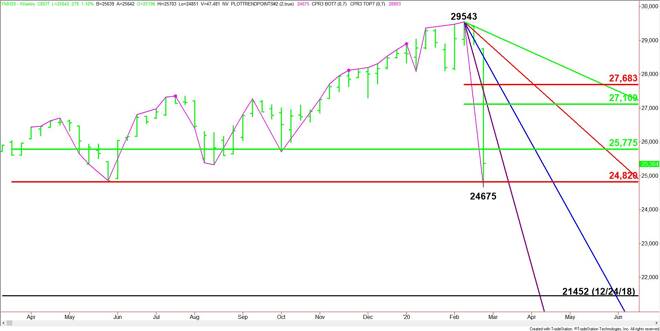
The main trend is down according to the weekly swing chart. The main trend turned down when sellers took out the last swing bottom at 28084. The downtrend was reaffirmed throughout the week when bottoms at 25710, 25326 and 24859 failed as support.
The main range is formed by the December 24, 2018 main bottom at 21452 and the February 13, 2020 main top at 29543. Its retracement zone at 25775 to 24820 is currently being tested. This zone is controlling the near-term direction of the Dow.
If a minor range forms between 29543 and 24675 then its retracement zone at 27109 to 27683 will become the primary upside target.
Weekly Technical Forecast
Based on last week’s price action and the close at 25364, the direction of the March E-mini Dow Jones Industrial Average this week is likely to be determined by trader reaction to the 50% level at 25775 and the Fibonacci level at 24820.
Bullish Scenario
Overtaking and sustaining a rally over 25775 will indicate the presence of buyers. If this move is able to generate enough upside momentum then look for the rally to possibly extend into the short-term 50% level at 27109, followed by a steep downtrending Gann angle at 28007.
Bearish Scenario
The first sign of weakness will be the inability to overcome the main 50% level at 25775. If this creates enough downside momentum then look for the selling to extend into the main Fibonacci level at 24820, followed closely by last week’s low at 24675.
Other potential downside targets come in at 23436, 22444 and 21948. The latter is the last potential support angle before the 21452 main bottom from 2018.
About the Author
James Hyerczykauthor
James Hyerczyk is a U.S. based seasoned technical analyst and educator with over 40 years of experience in market analysis and trading, specializing in chart patterns and price movement. He is the author of two books on technical analysis and has a background in both futures and stock markets.


Advertisement