
Advertisement
Advertisement
E-mini NASDAQ-100 Index (NQ) Futures Technical Analysis – August 11, 2015 Forecast
By:
September E-mini NASDAQ-100 Index futures soared on Monday, but the buying slowed when the index reached a short-term retracement zone. The rally was
September E-mini NASDAQ-100 Index futures soared on Monday, but the buying slowed when the index reached a short-term retracement zone. The rally was driven by bullish comments from a Fed official regarding the timing of the first Fed rate hike since 2006. Earlier in the session, China devalued its currency. There was little reaction to this news during the pre-market session, but investors may react later in the day once they digest its impact.
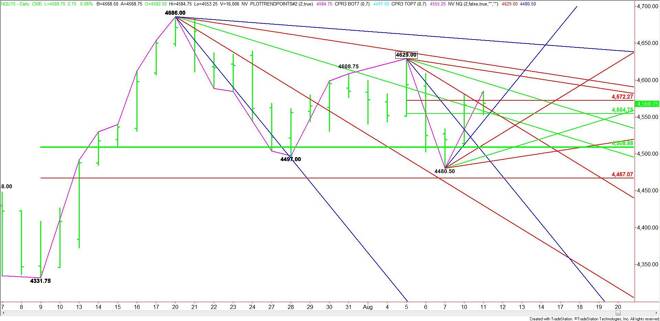
The main trend is down according to the daily swing chart. The main range is 4331.75 to 4686.00. Its retracement zone at 4508.75 to 4467.00 provided support last week when the index traded 4480.50.
The new short-term range is 4629.00 to 4480.50. Its retracement zone is 4554.75 to 4572.25. This zone was tested on Monday and is currently being tested during the pre-market session. Trader reaction to this zone will set the tone for the day. A downtrending angle also passes through this zone at 4565.00, making it a valid price target also.
A sustained move over the Fibonacci level at 4572.25 will indicate the presence of buyers. The first target is a downtrending angle at 4558.00. The next potential resistance is a pair of downtrending angles at 4613.00 and 4622.00. Taking out this angles will indicate that the buying is getting stronger.
A trade through 4629.00 will change the main trend to up on the daily chart. This could trigger a fast rally into the next downtrending angle at 4654.00. This is the last potential resistance before the 4686.00 contract high.
On the downside, a trade through the 50% level at 4554.75 will signal the presence of sellers. The first target is a steep uptrending angle at 4544.50. The daily chart opens up to the downside with the next targets coming in at 4512.50, 4508.75 and 4488.50. The latter is the last potential support before the 4480.50 main bottom.
The direction of the market today will be determined by trader reaction to the 4554.75 to 4572.25 retracement zone. Look for a bullish tone to develop on a sustained move over 4572.25 and a bearish tone to develop on a sustained move under 4554.75. Try to avoid getting chopped up if the index remains inside this zone.
About the Author
James Hyerczykauthor
James Hyerczyk is a U.S. based seasoned technical analyst and educator with over 40 years of experience in market analysis and trading, specializing in chart patterns and price movement. He is the author of two books on technical analysis and has a background in both futures and stock markets.


Advertisement