September E-mini NASDAQ-100 Index futures closed higher on Friday and in a position to continue the move on Monday. There could be some volatility on the
September E-mini NASDAQ-100 Index futures closed higher on Friday and in a position to continue the move on Monday. There could be some volatility on the pre-market opening because of hawkish comments from Fed Vice Chair Stanley Fischer over the week-end. Fischer said that despite the recent market volatility, the central bank remains on track to raise rates in 2015.
A better-than-expected U.S. Non-Farm Payrolls report on Friday could move the timeline for a rate hike forward. This could be bearish for stocks. During the time leading up to the jobs report, we could be looking at the possibility of a choppy, two-sided trade on below average volume. Traders should also watch for volatility early Tuesday because of the release of manufacturing PMI data from China.
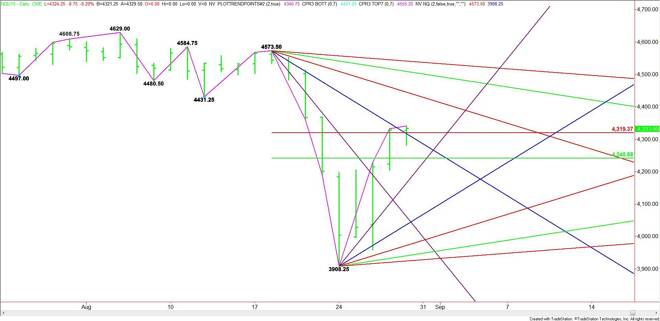
Technically, the main trend is down on the daily chart. The main range is 4573.50 to 3908.25. Its retracement zone is 4240.75 to 4319.25. Trader reaction to this zone especially the Fib level at 4319.25 should set the tone for the day and perhaps the week.
Based on Friday’s close at 4333.00, the first downside targets to watch are the Fib number at 4319.25 and a steep downtrending angle at 4285.50. A sustained move under 4285.00 will indicate the presence of sellers. This could trigger a break into the 50% level at 4240.75.
The 50% level could provide support on its initial test, but if it fails to hold then look for the break to extend into 4164.25. This is followed by another uptrending angle at 4036.25 today.
A sustained move over 4391.25 will signal the presence of buyers. The daily chart indicates there is room to the upside with the next target a downtrending angle at 4429.50. This is followed by another angle at 4501.50.
Watch the price action and read the order flow at 4319.25 today. Trader reaction to this price should tell us whether the bulls or the bears are in control. Do the same thing at the 50% level at 4240.75.
Be careful buying strength and selling weakness if the volume is below average. Try not to get chopped up inside 4240.75 to 4319.50.
James Hyerczyk is a U.S. based seasoned technical analyst and educator with over 40 years of experience in market analysis and trading, specializing in chart patterns and price movement. He is the author of two books on technical analysis and has a background in both futures and stock markets.