
Advertisement
Advertisement
E-mini NASDAQ-100 Index (NQ) Futures Technical Analysis – August 4, 2015 Forecast
By:
September E-mini NASDAQ-100 Index futures are trading flat-to-lower shortly before the cash market opening. The main trend is up according to the daily
September E-mini NASDAQ-100 Index futures are trading flat-to-lower shortly before the cash market opening. The main trend is up according to the daily swing chart, but momentum appears to be shifting to the downside. This may not mean the trend is getting ready to turn down, but it could just be consolidation ahead of Friday’s U.S. Non-Farm Payrolls report. This report is important because it could dictate whether the Fed raises rates in September or waits until December.
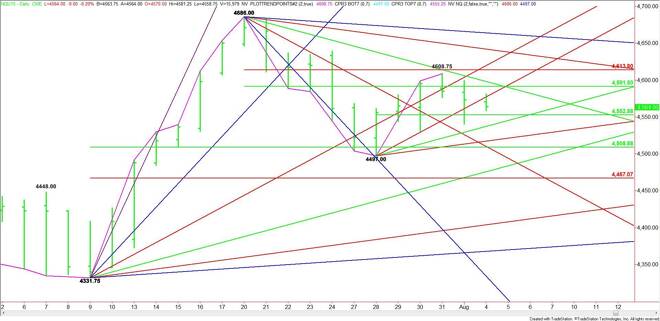
The main range is 4686.00 to 4497.00. Its retracement zone is 4591.50 to 4613.75. This zone stopped the market on Friday at 4608.75 and on Monday at 4599.25.
The short-term range is 4497.00 to 4608.75. Its pivot is 4552.75. Trader reaction today will likely determine the short-term direction of the market.
On the upside, the nearest uptrending angle is at 4577.00. This is followed by a 50% level at 4591.50 and a downtrending angle at 4598.00. The daily chart opens up to the upside over this level with the Fibonacci level at 4613.75 the next target, followed by another uptrending angle at 4619.75.
The last two downtrending angles before the 4686.00 main top come in at 4642.00 and 4664.00.
A failure to hold the pivot at 4552.75 will signal the presence of sellers with the first target an uptrending angle at 4537.00. The next angle is at 4517.00.
A major 50% level comes in at 4508.75. This is followed by a main bottom at 4497.00. The main trend will change to down if 4497.00 is taken out with the next targets 4475.75 and 4467.00.
There are no price clusters today so the market will move from level to level. This could produce a choppy, two-sided trade. Watch and read the price action at 4552.75 today. This should tell us whether the bulls or the bears are in control.
About the Author
James Hyerczykauthor
James Hyerczyk is a U.S. based seasoned technical analyst and educator with over 40 years of experience in market analysis and trading, specializing in chart patterns and price movement. He is the author of two books on technical analysis and has a background in both futures and stock markets.


Advertisement