September E-mini NASDAQ-100 Index futures are trading slightly better during the pre-market session. Volume is light and the range is tight. Yesterday,
September E-mini NASDAQ-100 Index futures are trading slightly better during the pre-market session. Volume is light and the range is tight. Yesterday, the index spiked higher on surprise news, but the market broke into the close. This suggests that short-covering was behind the rally. For the most part, the index is expected to be range bound today, ahead of Friday’s U.S. Non-Farm Payrolls report.
The main trend is up according to the daily swing chart. The index is currently straddling a retracement zone as investors wait for clarity from the jobs report. Sellers are trying to form a potentially bearish secondary lower top. Buyers are waiting to drive the market into a new contract high.
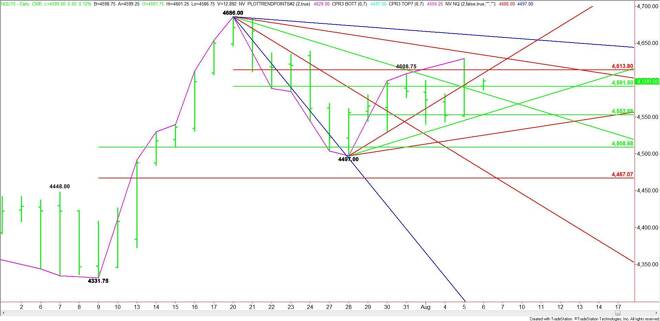
The main range is 4686.00 to 4497.00. Its retracement zone at 4591.50 to 4613.75 is currently being tested. The lower or 50% number is currently controlling the direction of the market.
A sustained move over 4591.50 will signal the presence of buyers. The first upside targets are an uptrending angle at 4609.00 and a Fibonacci level at 4613.75. The Fib level is a potential trigger point for an upside breakout into a downtrending angle at 4634.00. Taking out this angle should trigger a further rally into 4660.00. This is the last major resistance angle before the 4686.00 main top.
A sustained move under 4591.50 will signal the presence of sellers. Crossing to the weak side of the downtrending angle at 4582.00 could trigger an acceleration into a support cluster at 4553.00 to 4552.75. The daily chart opens up further under this cluster with 4525.00 the next likely downside target.
The angle at 4525.00 is the last potential support before a 50% level at 4508.75 and a main bottom at 4497.00. A trade through this level will turn the main trend to down.
Watch and read the price action and order flow at 4591.50. This will tell us whether the bulls or the bears are in control.
James Hyerczyk is a U.S. based seasoned technical analyst and educator with over 40 years of experience in market analysis and trading, specializing in chart patterns and price movement. He is the author of two books on technical analysis and has a background in both futures and stock markets.